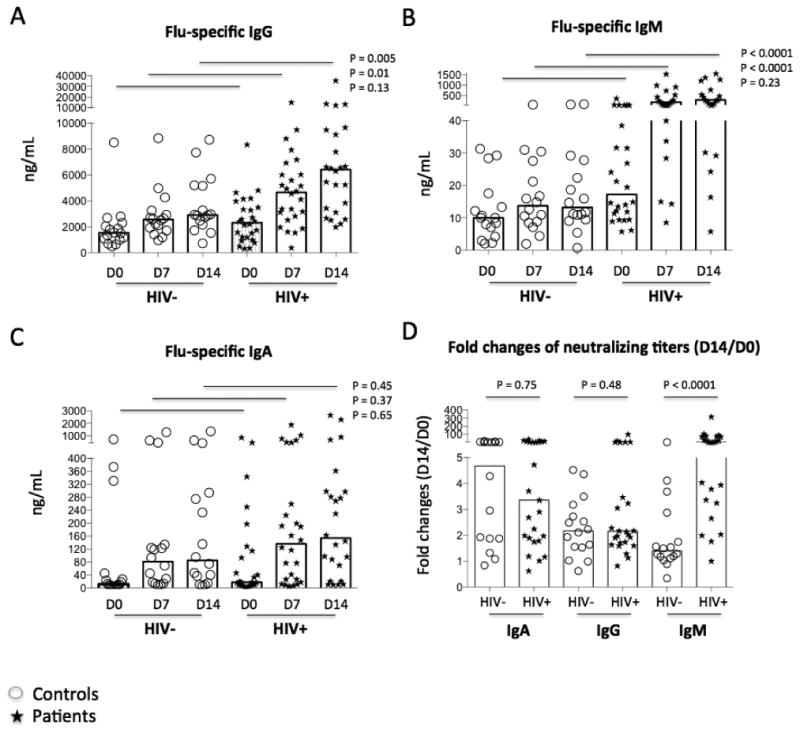
Figure 2.

Plasma levels of antigen-specific antibody. Homologous vaccines were used as Ags to coat the plates. Plasma samples from controls (circles) and patients (stars) were diluted and tested. Median concentrations of vaccine Ag-specific IgG (A), IgM (B), and IgA (C) were shown on D0, D7 and D14 by ELISA. (D) Fold changes of Ab levels (D14 versus D0).
