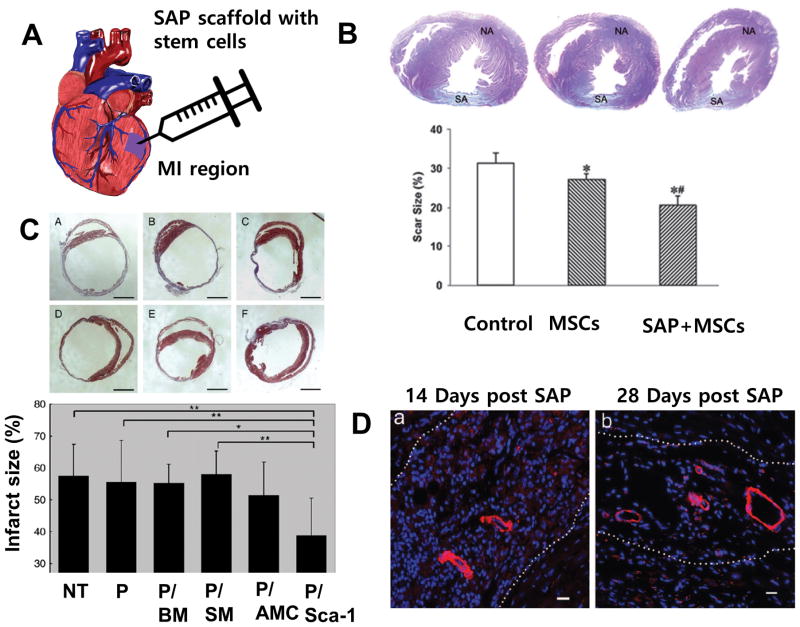
Figure 4.
Application of SAPs to cardiac tissue repair in the animal model. A. Conceptual illustration of injection of SAP and stem cells into the damaged myocardium. B. (above) Masson trichrome staining of heart sections at four weeks after myocardial infarction, observed under a light microscope. NA: normal area, SA: scar area. (below) Infarct area as determined by percent of total LV area for the no treatment control, stem cells only and cells with scaffold (p<0.001 vs. control, p<0.001 vs. cell alone).64 Reprinted with permission from ref. 64. C. (above) Treating with SAP and cSca-1 cells diminishes infarct expansion as seen in Masson trichrome stained heart slices and corresponding infarct size graph (below) 14 days after transplantation. The slices and graph depict; non-treated MI (A), SAP only (B), bone marrow stem cell with SAP (C), skeletal myoblasts with SAP (D), adipose-tissue derived mesenchymal cells with SAP (E) and cardiac progenitor cells with SAP (F). Data shows mean +/− SD. P < 0.05 cSca-1 with SAP vs. BM with SAP and p<0.01 for cSca-1 with SAP vs. non-treated MI, SAP only and skeletal myoblasts with SAP.69 Reprinted with permission from ref. 69. D. Mature vessel-like structures are detected in the SAP scaffold 14 days post injection (a) and after 28 days (b) several arteriole-like structures were seen within the microenvironment in all samples. Cells (blue, DAPI) are in the microenvironment positively stained for alpha - smooth muscle actin antibody.67 Reprinted with permission from ref. 67.

