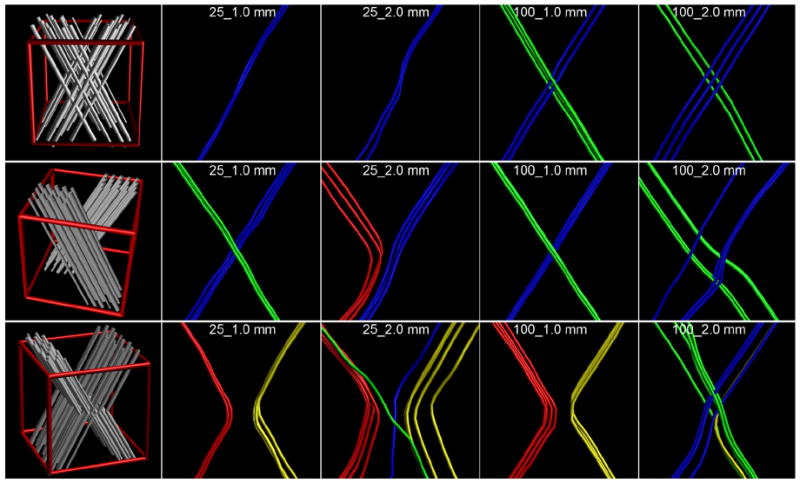
Fig. 1.

View of the three simulated complex geometries. The top row shows crossing or interdigitating fibers; the middle row brushing fibers; the bottom row shows kissing fibers. The left-most panel in each row is an illustration of how such a configuration looks, with the red cube indicating a 2 mm isotropic voxel in which such a configuration is simulated. The results are shown for four combinations of spatial and angular resolutions. To clearly indicate which tracts connect which branches, the tracts have been color-coded as: blue connects the top-right with the bottom-left; green connects top-left with bottom-right; red connects top-left with bottom-left; and yellow connects top-right with bottom-right. For the top two rows, with crossing and brushing fibers, the green and blue tracts are correct; for the bottom row, with kissing fibers, the red and yellow tracts are correct.
