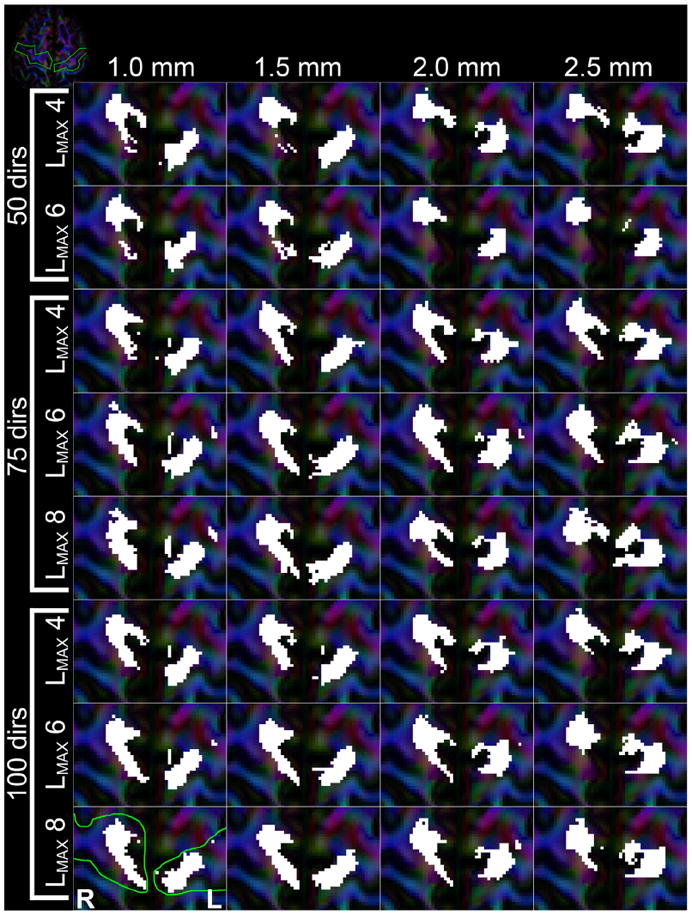
Fig. 15.

Visualization of where fiber tracts of the bilateral M1–M1 tracts intersect the cortical areas. Each subpanel represents results from the different reconstructed datasets, with columns being different spatial resolutions and each row a combination of number of gradient directions and used LMAX, as indicated in the figure. White areas indicate voxels that were intersected by fiber tracts. The green line on the 100_1.0 LMAX = 8 panel indicates the ROI that selects the cortices. The inset in the top-left corner shows an overview of the axial slice, with the gyri of interest outlined in green.
