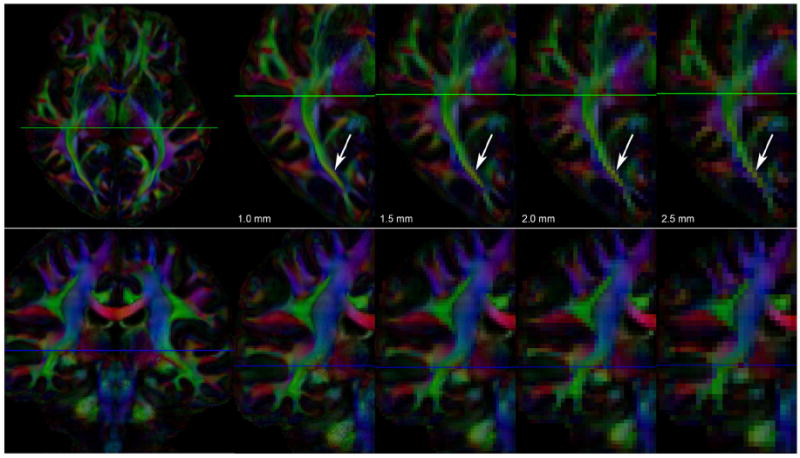
Fig. 3.

Axial and coronal views (top and bottom rows, respectively) of the DEC-maps of datasets with 100 gradient directions reconstructed at four different spatial resolutions: 1.0, 1.5, 2.0, and 2.5 mm. The voxel volumes of these datasets are 1, 3.375, 8, and 15.625 mm3, respectively. For both rows, the left-most panel shows the entire slice at 1 mm resolution. For the axial view in the top row, the zoomed-in area shows the posterior half of one hemisphere; for the coronal view in the bottom row, the zoomed-in area shows one hemisphere. The green lines in the axial image indicate the shown coronal slices; the blue lines in the coronal image the shown axial slices. The differences in spatial resolution are strongly reflected in the amount of partial volume effect, as most clearly seen in the posterior part of the optic radiation (indicated by the arrows).
