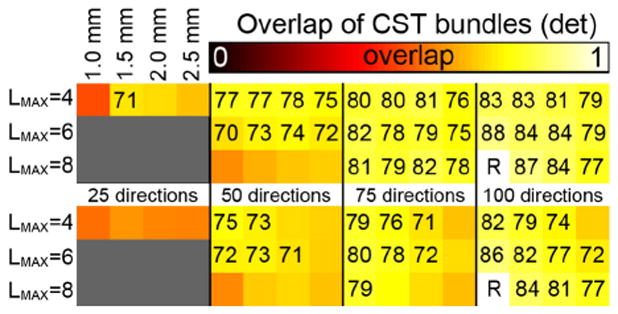
Fig. 6.

Volumetric overlap between the CST fiber tracts reconstructed from datasets with different spatial and angular resolutions using deterministic tractography. The top panel shows overlap values for the left CST, the bottom panel for the right CST. The overlap values are with respect to the 100_1.0 mm tracts with LMAX = 8. For each panel, the rows indicate the LMAX values used, the columns indicate the angular and spatial resolutions of the data as indicated. Overlap values (×100) are given in case of moderate overlap, i.e., ≥0.7.
