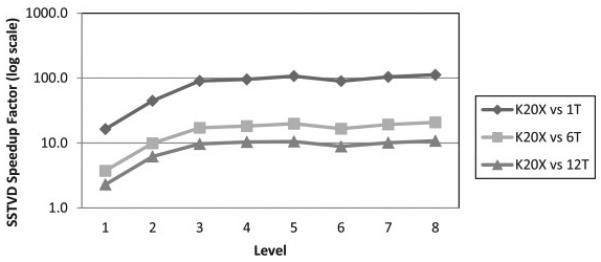
Fig. 4.

Speedup factors for SSTVD implementation of the cost and cost gradient components, comparing the GPU implementation to single-, six-, and twelve-threaded (1 T, 6 T, 12 T) CPU versions. Log scale used for speedup axis. Values shown are averaged for 6 healthy subjects at each of the 8 levels of the image pyramid.
