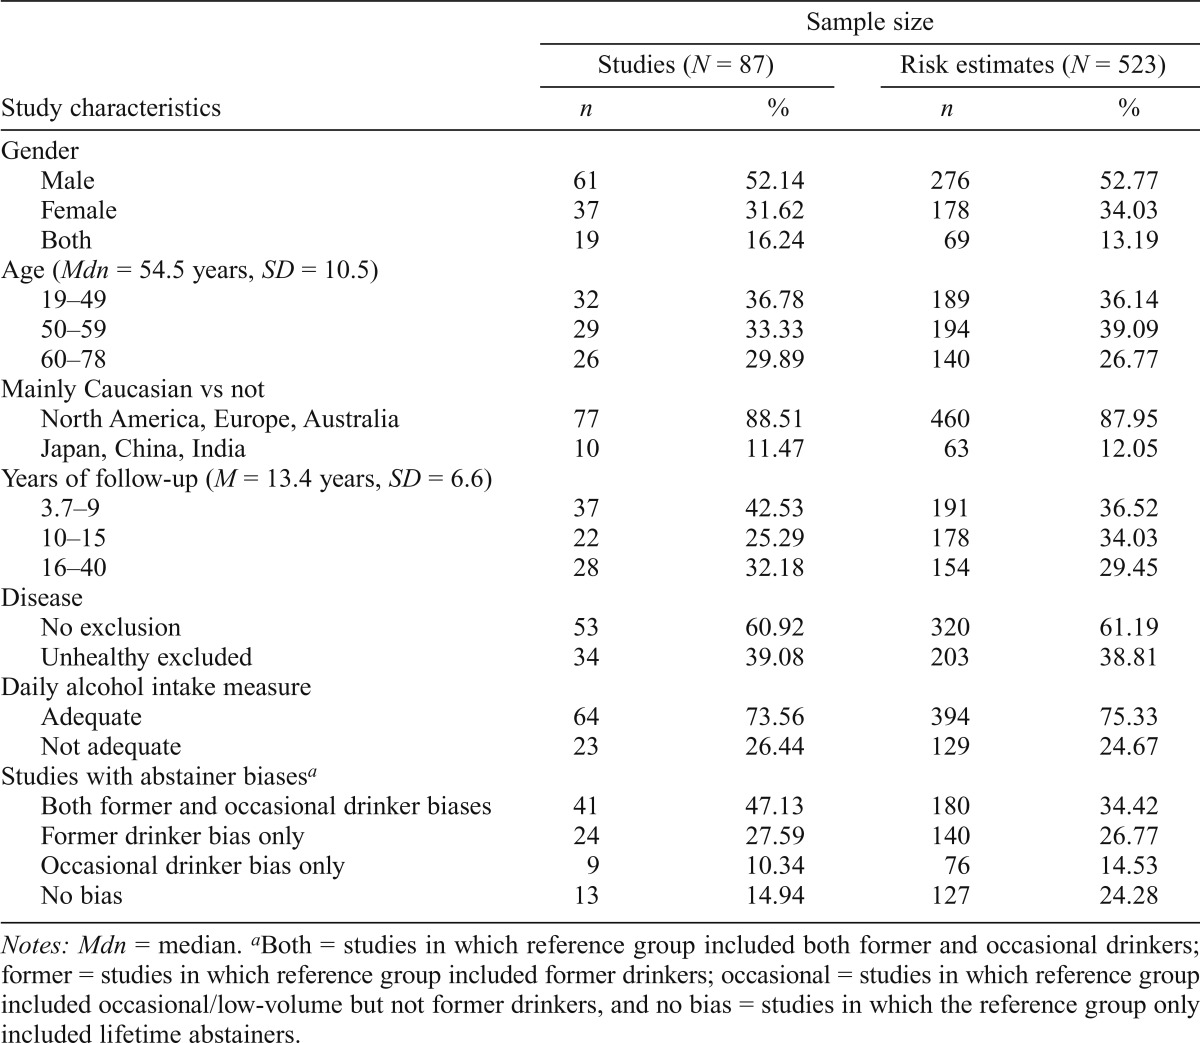
Table 1.
Characteristics of all studies included in meta-analyses on alcohol use and all-cause mortality
| Sample size |
||||
| Studies (N = 87) |
Risk estimates (N = 523) |
|||
| Study characteristics | n | % | n | % |
| Gender | ||||
| Male | 61 | 52.14 | 276 | 52.77 |
| Female | 37 | 31.62 | 178 | 34.03 |
| Both | 19 | 16.24 | 69 | 13.19 |
| Age (Mdn = 54.5 years, SD = 10.5) | ||||
| 19–49 | 32 | 36.78 | 189 | 36.14 |
| 50–59 | 29 | 33.33 | 194 | 39.09 |
| 60–78 | 26 | 29.89 | 140 | 26.77 |
| Mainly Caucasian vs not | ||||
| North America, Europe, Australia | 77 | 88.51 | 460 | 87.95 |
| Japan, China, India | 10 | 11.47 | 63 | 12.05 |
| Years of follow-up (M = 13.4 years, SD = 6.6) | ||||
| 3.7–9 | 37 | 42.53 | 191 | 36.52 |
| 10–15 | 22 | 25.29 | 178 | 34.03 |
| 16–40 | 28 | 32.18 | 154 | 29.45 |
| Disease | ||||
| No exclusion | 53 | 60.92 | 320 | 61.19 |
| Unhealthy excluded | 34 | 39.08 | 203 | 38.81 |
| Daily alcohol intake measure | ||||
| Adequate | 64 | 73.56 | 394 | 75.33 |
| Not adequate | 23 | 26.44 | 129 | 24.67 |
| Studies with abstainer biasesa | ||||
| Both former and occasional drinker biases | 41 | 47.13 | 180 | 34.42 |
| Former drinker bias only | 24 | 27.59 | 140 | 26.77 |
| Occasional drinker bias only | 9 | 10.34 | 76 | 14.53 |
| No bias | 13 | 14.94 | 127 | 24.28 |
Notes: Mdn = median.
Both = studies in which reference group included both former and occasional drinkers; former = studies in which reference group included former drinkers; occasional = studies in which reference group included occasional/low-volume but not former drinkers, and no bias = studies in which the reference group only included lifetime abstainers.

