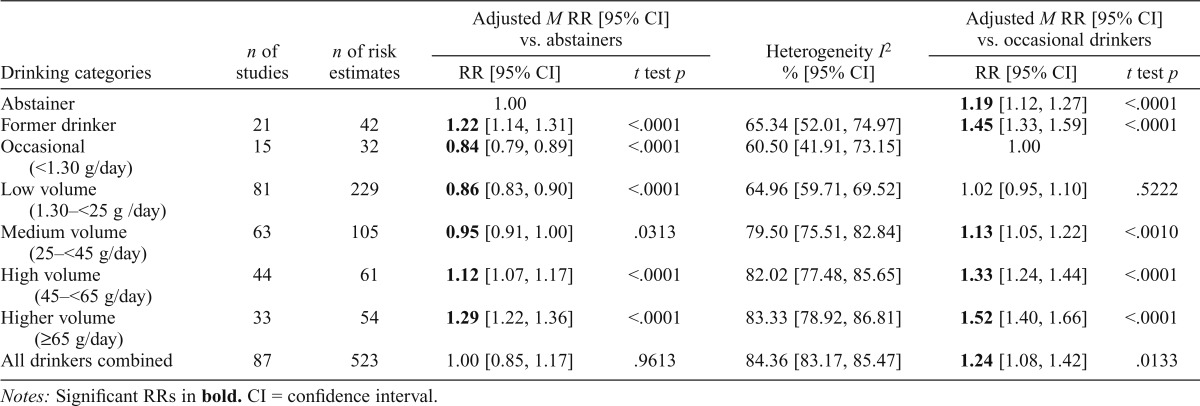
Table 2.
Weighted mean relative risk (RR) estimates of all-cause mortality adjusted for between-study variation for different categories of drinkers compared with abstainers (N = 87 studies and 523 risk estimates) with tests of publication bias and heterogeneity, but not adjusted for study characteristics
| Adjusted M RR [95% CI] vs. abstainers |
Adjusted M RR [95% CI] vs. occasional drinkers |
||||||
| Drinking categories | n of studies | n of estimates | RR [95% CI] | t test p | Heterogeneity I2 % [95% CI] | RR [95% CI] | t test p |
| Abstainer | 1.00 | 1.19 [1.12, 1.27] | <.0001 | ||||
| Former drinker | 21 | 42 | 1.22 [1.14, 1.31] | <.0001 | 65.34 [52.01, 74.97] | 1.45 [1.33, 1.59] | <.0001 |
| Occasional (<1.30 g/day) | 15 | 32 | 0.84 [0.79, 0.89] | <.0001 | 60.50 [41.91, 73.15] | 1.00 | |
| Low volume (1.30–<25 g/day) | 81 | 229 | 0.86 [0.83, 0.90] | <.0001 | 64.96 [59.71, 69.52] | 1.02 [0.95, 1.10] | .5222 |
| Medium volume (25–<45 g/day) | 63 | 105 | 0.95 [0.91, 1.00] | .0313 | 79.50 [75.51, 82.84] | 1.13 [1.05, 1.22] | <.0010 |
| High volume (45–<65 g/day) | 44 | 61 | 1.12 [1.07, 1.17] | <.0001 | 82.02 [77.48, 85.65] | 1.33 [1.24, 1.44] | <.0001 |
| Higher volume (≥65 g/day) | 33 | 54 | 1.29 [1.22, 1.36] | <.0001 | 83.33 [78.92, 86.81] | 1.52 [1.40, 1.66] | <.0001 |
| All drinkers combined | 87 | 523 | 1.00 [0.85, 1.17] | .9613 | 84.36 [83.17, 85.47] | 1.24 [1.08, 1.42] | .0133 |
Notes: Significant RRs in bold. CI = confidence interval.

