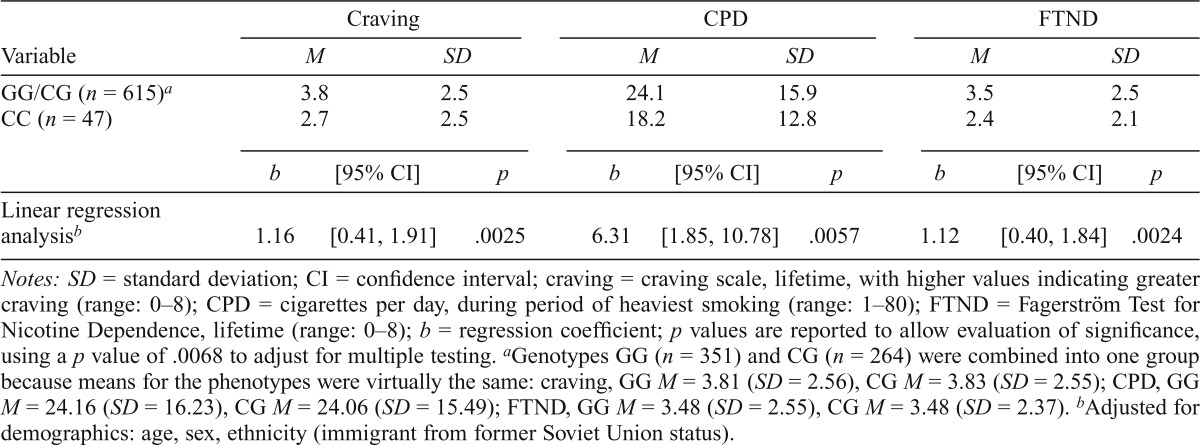
Table 3.
Association between nicotine phenotypes and rs3743078 in lifetime smokers (n = 662)
| Craving |
CPD |
FTND |
|||||||
| Variable | M | SD | M | SD | M | SD | |||
| GG/CG (n = 615)a | 3.8 | 2.5 | 24.1 | 15.9 | 3.5 | 2.5 | |||
| CC (n = 47) | 2.7 | 2.5 | 18.2 | 12.8 | 2.4 | 2.1 | |||
| b | [95% CI] | p | b | [95% CI] | p | b | [95% CI] | p | |
| Linear regression analysisb | 1.16 | [0.41, 1.91] | .0025 | 6.31 | [1.85, 10.78] | .0057 | 1.12 | [0.40, 1.84] | .0024 |
Notes: SD = standard deviation; CI = confidence interval; craving = craving scale, lifetime, with higher values indicating greater craving (range: 0–8); CPD = cigarettes per day, during period of heaviest smoking (range: 1–80); FTND = Fagerström Test for Nicotine Dependence, lifetime (range: 0–8); b = regression coefficient; p values are reported to allow evaluation of significance, using a p value of .0068 to adjust for multiple testing.
Genotypes GG (n = 351) and CG (n = 264) were combined into one group because means for the phenotypes were virtually the same: craving, GG M = 3.81 (SD = 2.56), CG M = 3.83 (SD = 2.55); CPD, GG M = 24.16 (SD = 16.23), CG M = 24.06 (SD = 15.49); FTND, GG M = 3.48 (SD = 2.55), CG M = 3.48 (SD = 2.37).
Adjusted for demographics: age, sex, ethnicity (immigrant from former Soviet Union status).

