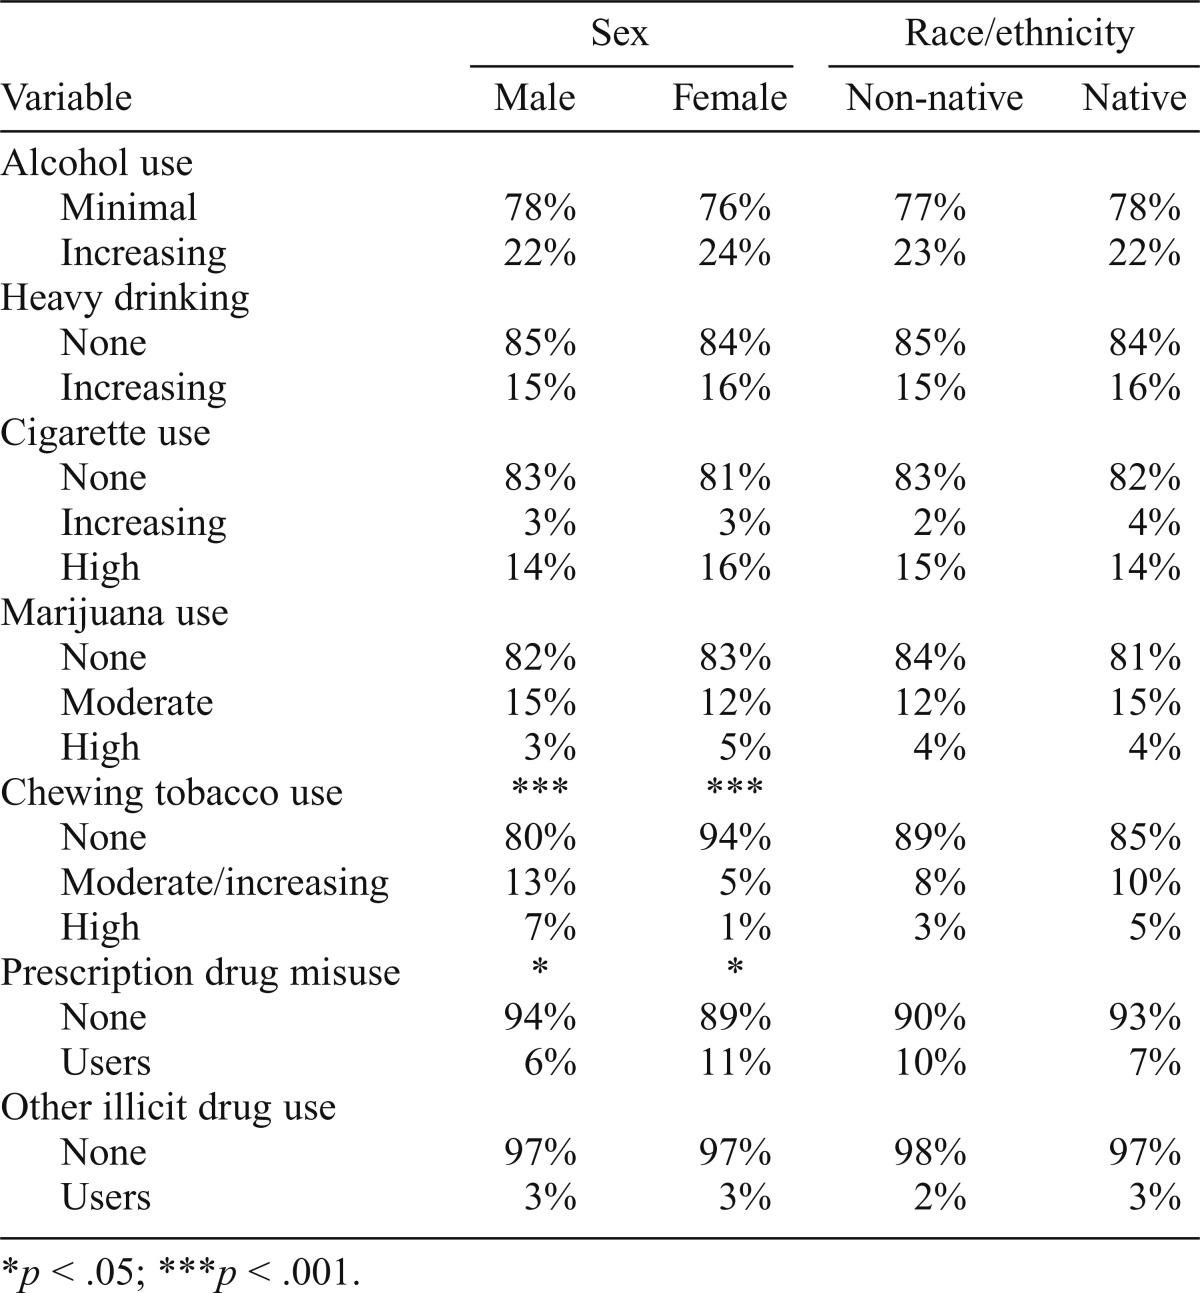
Table 3.
Sex and racial/ethnic differences within trajectory group
| Sex |
Race/ethnicity |
|||
| Variable | Male | Female | Non-native | Native |
| Alcohol use | ||||
| Minimal | 78% | 76% | 77% | 78% |
| Increasing | 22% | 24% | 23% | 22% |
| Heavy drinking | ||||
| None | 85% | 84% | 85% | 84% |
| Increasing | 15% | 16% | 15% | 16% |
| Cigarette use | ||||
| None | 83% | 81% | 83% | 82% |
| Increasing | 3% | 3% | 2% | 4% |
| High | 14% | 16% | 15% | 14% |
| Marijuana use | ||||
| None | 82% | 83% | 84% | 81% |
| Moderate | 15% | 12% | 12% | 15% |
| High | 3% | 5% | 4% | 4% |
| Chewing tobacco use | *** | *** | ||
| None | 80% | 94% | 89% | 85% |
| Moderate/increasing | 13% | 5% | 8% | 10% |
| High | 7% | 1% | 3% | 5% |
| Prescription drug misuse | * | * | ||
| None | 94% | 89% | 90% | 93% |
| Users | 6% | 11% | 10% | 7% |
| Other illicit drug use | ||||
| None | 97% | 97% | 98% | 97% |
| Users | 3% | 3% | 2% | 3% |
p < .05;
p < .001.

