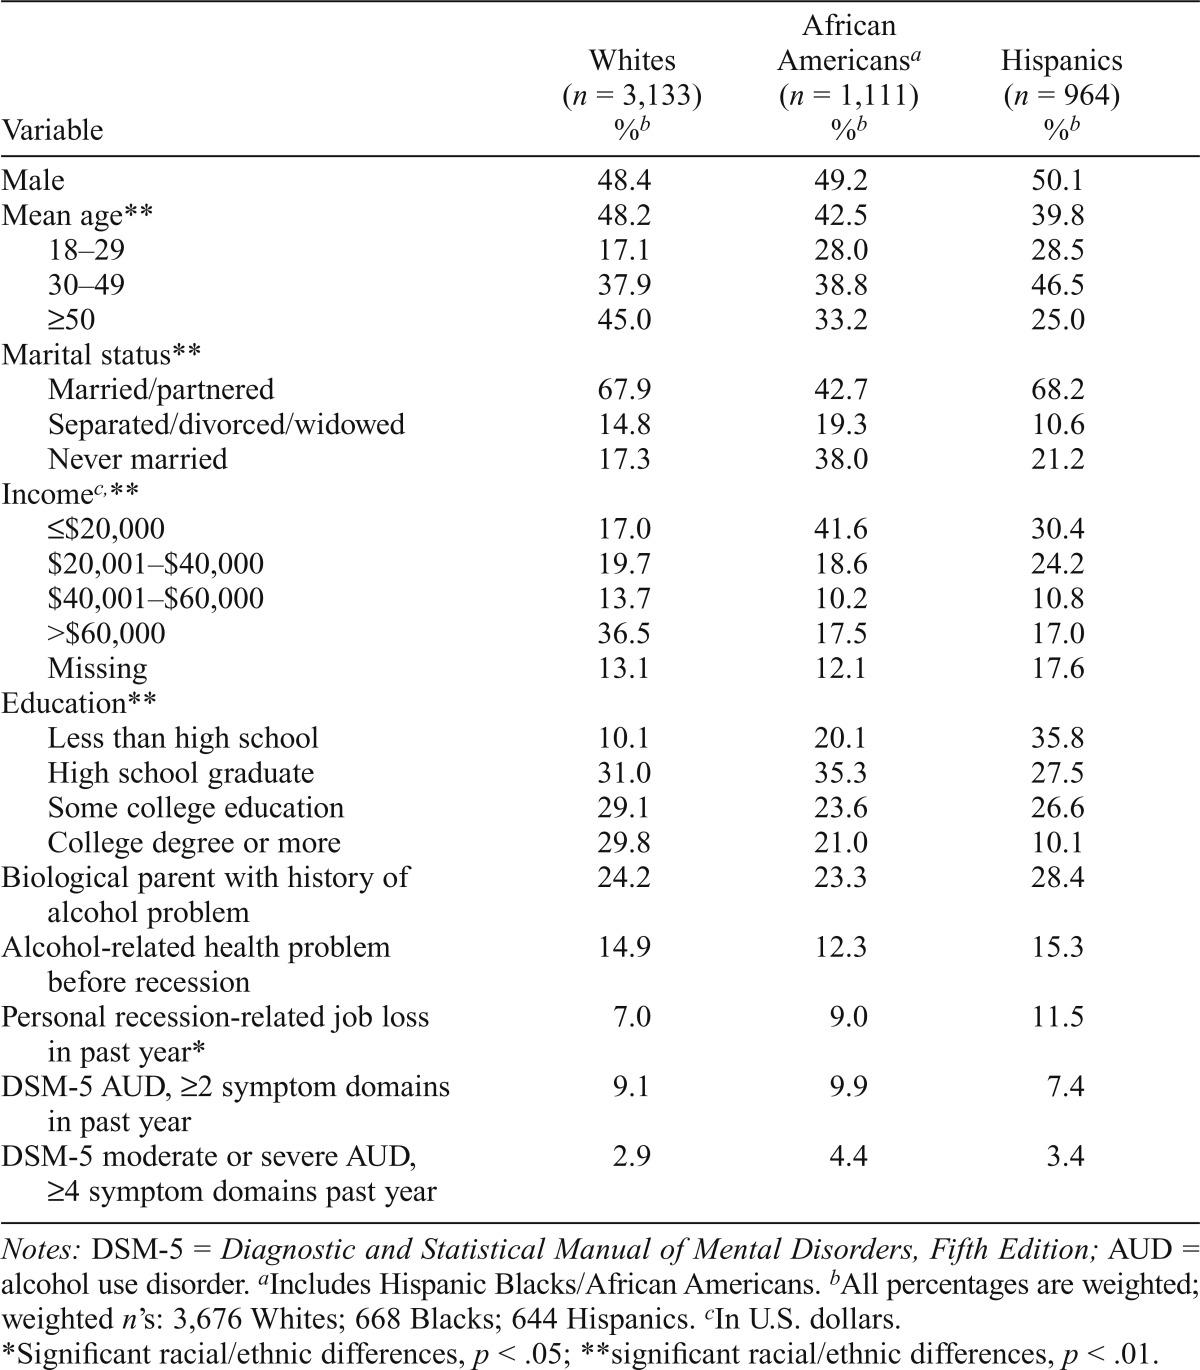
Table 1.
Sample characteristics, 2010 U.S. National Alcohol Survey landline respondents
| Variable | Whites (n = 3,133) %b | African Americansa (n = 1,111) %b | Hispanics (n = 964) %b |
| Male | 48.4 | 49.2 | 50.1 |
| Mean age** | 48.2 | 42.5 | 39.8 |
| 18–29 | 17.1 | 28.0 | 28.5 |
| 30–49 | 37.9 | 38.8 | 46.5 |
| ≥50 | 45.0 | 33.2 | 25.0 |
| Marital status** | |||
| Married/partnered | 67.9 | 42.7 | 68.2 |
| Separated/divorced/widowed | 14.8 | 19.3 | 10.6 |
| Never married | 17.3 | 38.0 | 21.2 |
| Incomec,** | |||
| ≤$20,000 | 17.0 | 41.6 | 30.4 |
| $20,001–$40,000 | 19.7 | 18.6 | 24.2 |
| $40,001–$60,000 | 13.7 | 10.2 | 10.8 |
| >$60,000 | 36.5 | 17.5 | 17.0 |
| Missing | 13.1 | 12.1 | 17.6 |
| Education** | |||
| Less than high school | 10.1 | 20.1 | 35.8 |
| High school graduate | 31.0 | 35.3 | 27.5 |
| Some college education | 29.1 | 23.6 | 26.6 |
| College degree or more | 29.8 | 21.0 | 10.1 |
| Biological parent with history of alcohol problem | 24.2 | 23.3 | 28.4 |
| Alcohol-related health problem before recession | 14.9 | 12.3 | 15.3 |
| Personal recession-related job loss in past year* | 7.0 | 9.0 | 11.5 |
| DSM-5 AUD, ≥2 symptom domains in past year | 9.1 | 9.9 | 7.4 |
| DSM-5 moderate or severe AUD, ≥4 symptom domains past year | 2.9 | 4.4 | 3.4 |
Notes: DSM-5 = Diagnostic and Statistical Manual of Mental Disorders, Fifth Edition; AUD = alcohol use disorder.
Includes Hispanic Blacks/African Americans.
All percentages are weighted; weighted n*s: 3,676 Whites; 668 Blacks; 644 Hispanics.
In U.S. dollars.
Significant racial/ethnic differences, p < .05;
significant racial/ethnic differences, p < .01.

