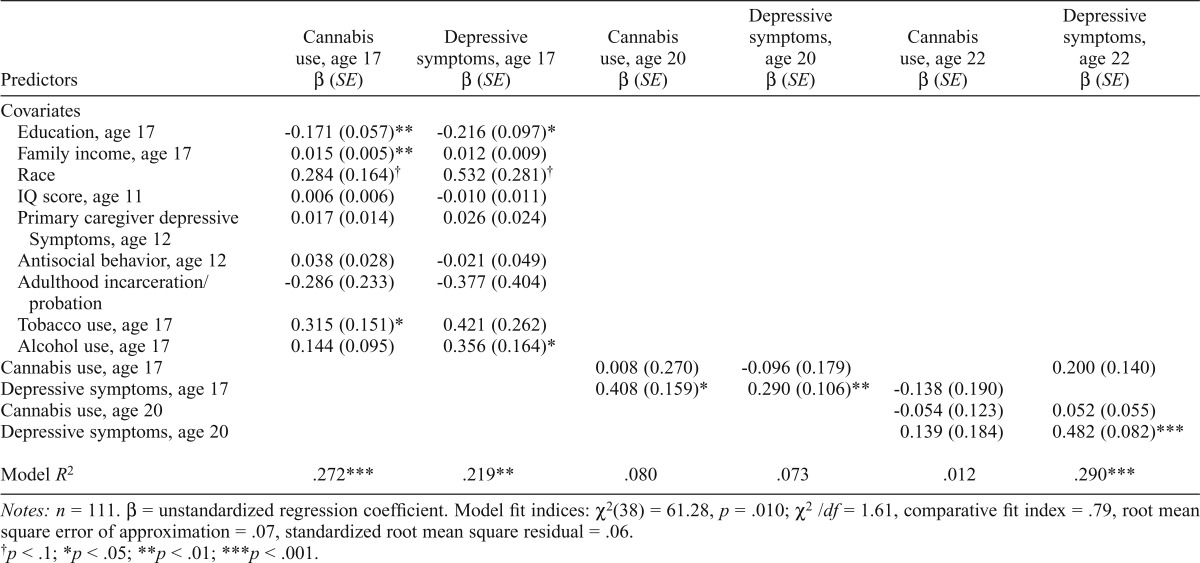
Table 4.
Cross-lag model for cannabis-user subsample
| Predictors | Cannabis use, age 17 β (SE) | Depressive symptoms, age 17 β (SE) | Cannabis use, age 20 β (SE) | Depressive symptoms, age 20 β (SE) | Cannabis use, age 22 β (SE) | Depressive symptoms, age 22 β (SE) |
| Covariates | ||||||
| Education, age 17 | -0.171 (0.057)** | -0.216 (0.097)* | ||||
| Family income, age 17 | 0.015 (0.005)** | 0.012 (0.009) | ||||
| Race | 0.284 (0.164)† | 0.532 (0.281)† | ||||
| IQ score, age 11 | 0.006 (0.006) | -0.010 (0.011) | ||||
| Primary caregiver depressive | 0.017 (0.014) | 0.026 (0.024) | ||||
| Symptoms, age 12 | ||||||
| Antisocial behavior, age 12 | 0.038 (0.028) | -0.021 (0.049) | ||||
| Adulthood incarceration/probation | -0.286 (0.233) | -0.377 (0.404) | ||||
| Tobacco use, age 17 | 0.315 (0.151)* | 0.421 (0.262) | ||||
| Alcohol use, age 17 | 0.144 (0.095) | 0.356 (0.164)* | ||||
| Cannabis use, age 17 | 0.008 (0.270) | -0.096 (0.179) | 0.200 (0.140) | |||
| Depressive symptoms, age 17 | 0.408 (0.159)* | 0.290 (0.106)** | -0.138 (0.190) | |||
| Cannabis use, age 20 | -0.054 (0.123) | 0.052 (0.055) | ||||
| Depressive symptoms, age 20 | 0.139 (0.184) | 0.482 (0.082)*** | ||||
| Model R2 | .272*** | .219** | .080 | .073 | .012 | .290*** |
Notes: n = 111. β = unstandardized regression coefficient. Model fit indices: χ2(38) = 61.28, p = .010; χ2/df = 1.61, comparative fit index = .79, root mean square error of approximation = .07, standardized root mean square residual = .06.
p < .1;
p < .05;
p < .01;
p < .001.

