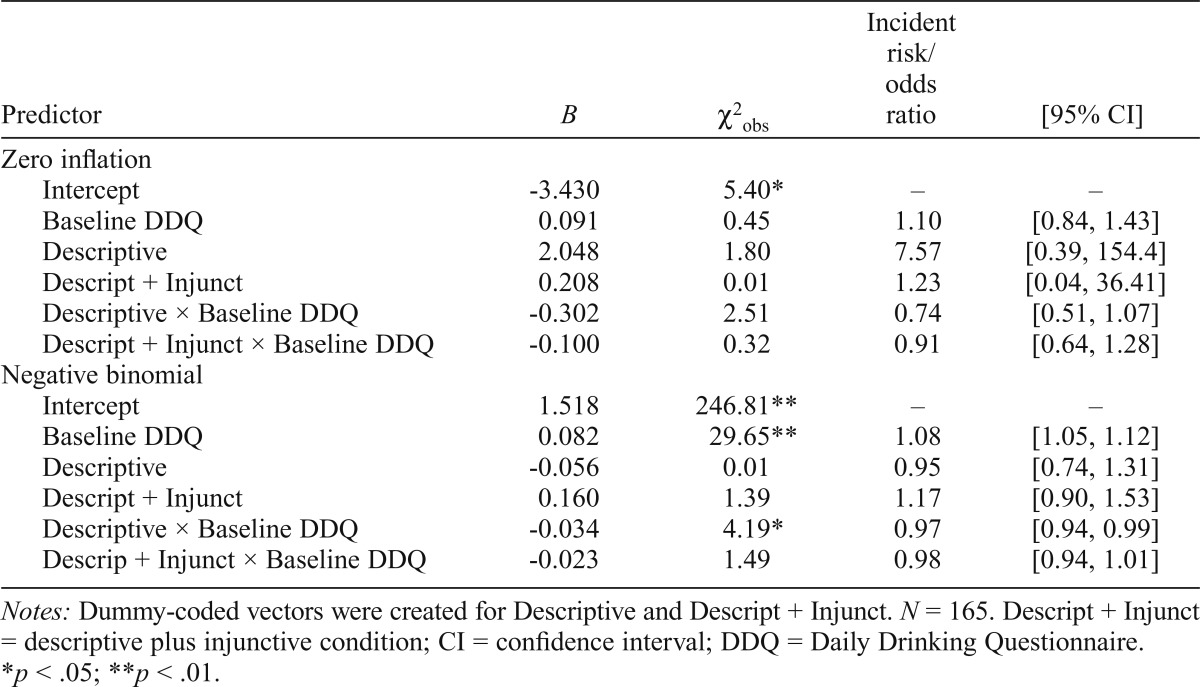
Table 1.
Changes in drinking at follow-up as a function of intervention conditions
| Predictor | B | χ2obs | Incident risk/odds ratio | [95% CI] |
| Zero inflation | ||||
| Intercept | -3.430 | 5.40* | – | – |
| Baseline DDQ | 0.091 | 0.45 | 1.10 | [0.84, 1.43] |
| Descriptive | 2.048 | 1.80 | 7.57 | [0.39, 154.4] |
| Descript + Injunct | 0.208 | 0.01 | 1.23 | [0.04, 36.41] |
| Descriptive × Baseline DDQ | -0.302 | 2.51 | 0.74 | [0.51, 1.07] |
| Descript + Injunct × Baseline DDQ | -0.100 | 0.32 | 0.91 | [0.64, 1.28] |
| Negative binomial | ||||
| Intercept | 1.518 | 246.81** | – | – |
| Baseline DDQ | 0.082 | 29.65** | 1.08 | [1.05, 1.12] |
| Descriptive | -0.056 | 0.01 | 0.95 | [0.74, 1.31] |
| Descript + Injunct | 0.160 | 1.39 | 1.17 | [0.90, 1.53] |
| Descriptive × Baseline DDQ | -0.034 | 4.19* | 0.97 | [0.94, 0.99] |
| Descrip + Injunct × Baseline DDQ | -0.023 | 1.49 | 0.98 | [0.94, 1.01] |
Notes: Dummy-coded vectors were created for Descriptive and Descript + Injunct. N = 165. Descript + Injunct = descriptive plus injunctive condition; CI = confidence interval; DDQ = Daily Drinking Questionnaire.
p < .05;
p < .01.

