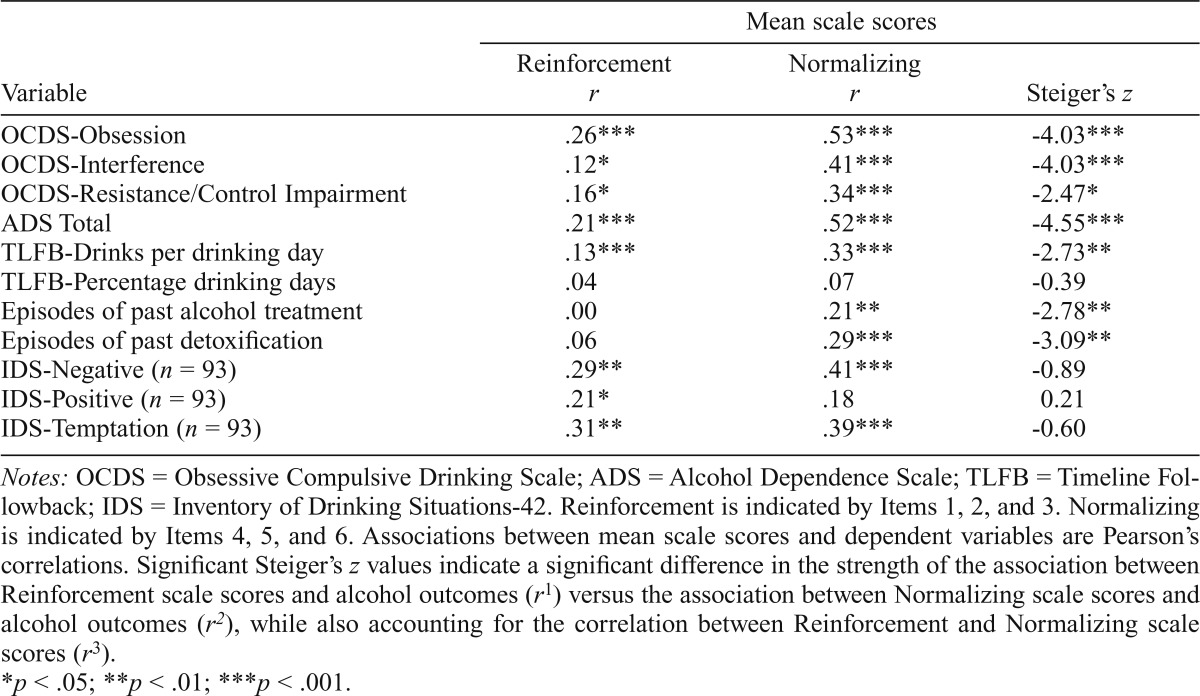
Table 4.
Associations between Reasons for Heavy Drinking Questionnaire scales and measures of craving, alcohol dependence severity, and drinking behavior (N = 265)
| Variable | Mean scale scores |
||
| Reinforcement r | Normalizing r | Steiger’s z | |
| OCDS-Obsession | .26*** | .53*** | -4.03*** |
| OCDS-Interference | .12* | .41*** | -4.03*** |
| OCDS-Resistance/Control Impairment | .16* | .34*** | -2.47* |
| ADS Total | .21*** | .52*** | -4.55*** |
| TLFB-Drinks per drinking day | .13*** | .33*** | -2.73** |
| TLFB-Percentage drinking days | .04 | .07 | -0.39 |
| Episodes of past alcohol treatment | .00 | .21** | -2.78** |
| Episodes of past detoxification | .06 | .29*** | -3.09** |
| IDS-Negative (n = 93) | .29** | .41*** | -0.89 |
| IDS-Positive (n = 93) | .21* | .18 | 0.21 |
| IDS-Temptation (n = 93) | .31** | .39*** | -0.60 |
Notes: OCDS = Obsessive Compulsive Drinking Scale; ADS = Alcohol Dependence Scale; TLFB = Timeline Followback; IDS = Inventory of Drinking Situations-42. Reinforcement is indicated by Items 1, 2, and 3. Normalizing is indicated by Items 4, 5, and 6. Associations between mean scale scores and dependent variables are Pearson’s correlations. Significant Steiger’s z values indicate a significant difference in the strength of the association between Reinforcement scale scores and alcohol outcomes (r1) versus the association between Normalizing scale scores and alcohol outcomes (r2), while also accounting for the correlation between Reinforcement and Normalizing scale scores (r3).
p < .05;
p < .01;
p < .001.

