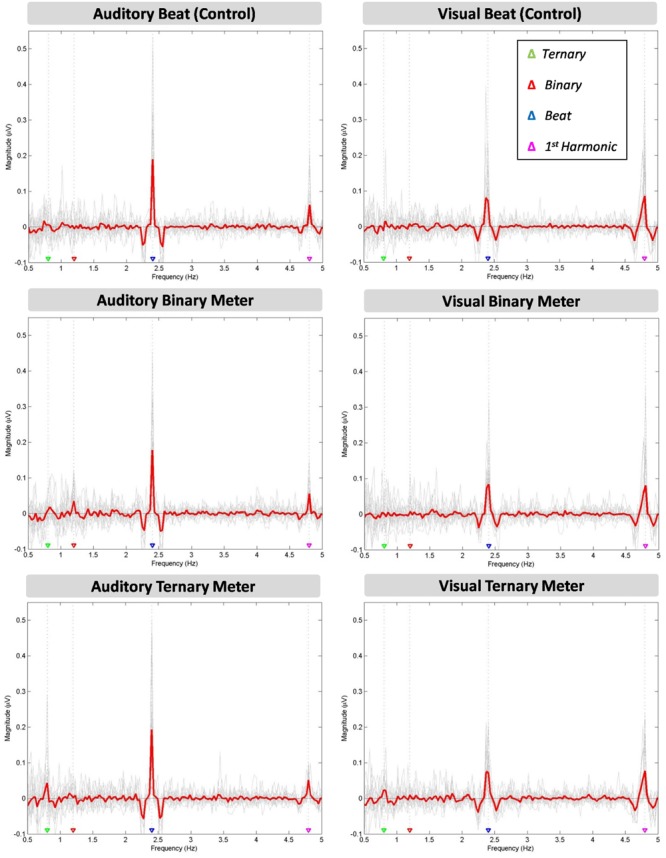
FIGURE 2.

Six amplitude spectra depicting the amplitude (μV) of the averaged EEG signal at each frequency between 0.5 and 5 Hz. The auditory (left column) and visual (right column) modalities are split into three conditions: the beat control (first row), the binary meter imagery task (second row), and the ternary meter imagery task (third row). The mean of all participants’ amplitudes (gray lines) is depicted in red for each condition and modality. The frequencies of the ternary meter, binary meter, beat, and its first harmonic are signaled with gray dotted lines and colored triangles over the abscissa: 0.8 Hz (green), 1.2 Hz (red), 2.4 Hz (blue) and 4.8 Hz (magenta).
