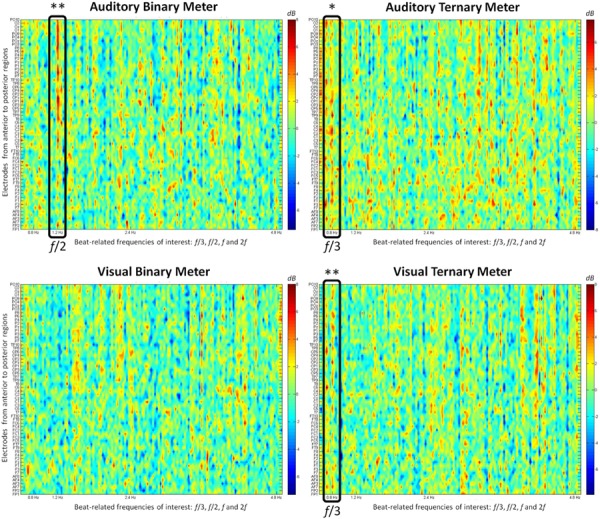
FIGURE 3.

The relative value (from -7 to 8 dB) obtained after subtracting the power spectrum (μV2/Hz) of the control condition from each metrical condition is shown at each electrode. The frequencies of interest (0.8, 1.2, 2.4, and 4.8 Hz) appear on the frequency axis (from 0.6 to 5 Hz). First row: auditory conditions. Second row: visual conditions. First column: binary meter task. Second column: ternary meter task. Black rectangles frame the relevant frequencies when their values are significantly distinct from zero. The electrodes are ordered from anterior to posterior regions, with odd and even numbers representing the right and left hemispheres, respectively. ∗ p < 0.05, ∗∗ p < 0.01.
