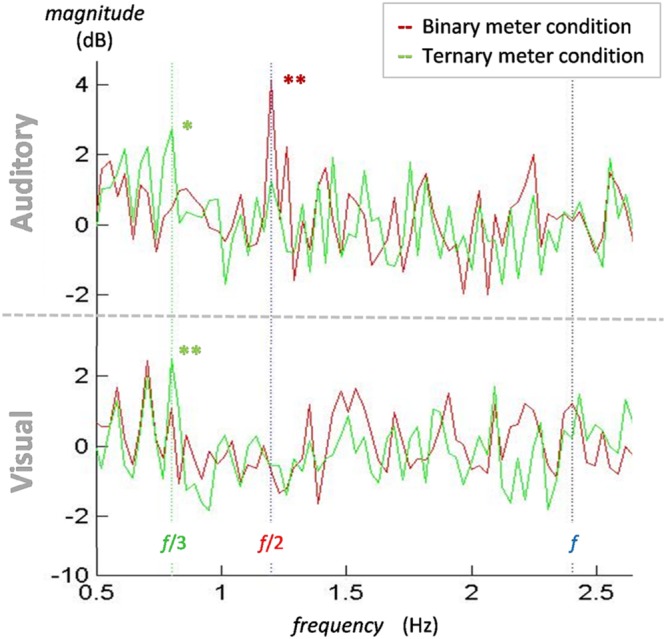
FIGURE 4.

Normalized power spectra of the binary and ternary conditions for the mean of all participants and electrodes in both the auditory and the visual modalities. In both auditory (top) and visual (bottom) modalities, a peak for the ternary condition (green line) appears at 0.8 Hz (green dotted line). A peak for the binary condition (red line) at 1.2 Hz (red dotted line) is only observed in the auditory modality. There is no contrasting peak at 2.4 Hz (blue dotted line) in either modality. ∗p < 0.05, ∗∗p < 0.01.
