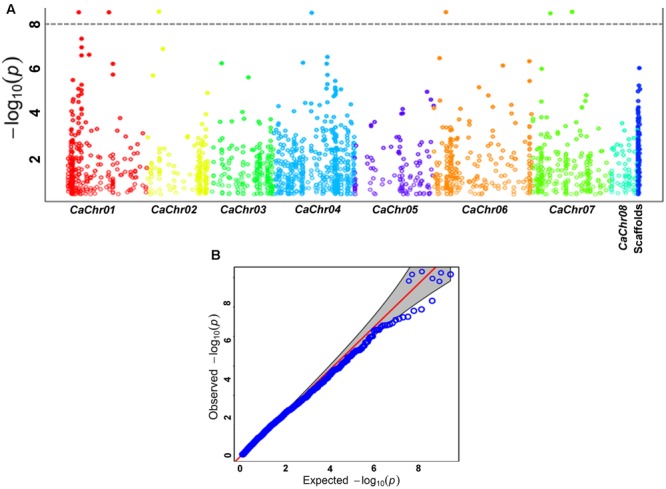
FIGURE 3.

(A) GWAS-based Manhattan plot illustrating significant P-values (measured by CMLM model) associated with seed-protein content (SPC %) using 16376 genome-wide GBS-SNPs in chickpea. The x-axis represents the relative density of SNPs physically mapped on eight chromosomes and scaffolds of kabuli genome. The y-axis denotes the –log10 (P)-value for significant association of seven SNPs with SPC trait. The SNPs revealing significant association with SPC trait at cut-off P-value ≤ 1 × 10⁻⁸ are demarcated with dotted lines. (B) Quantile-quantile plot depicting the comparison between expected and observed –log10 (P)-values at a FDR cut-off < 0.05 to scan the significant genomic SNP loci associated with SPC trait in chickpea.
