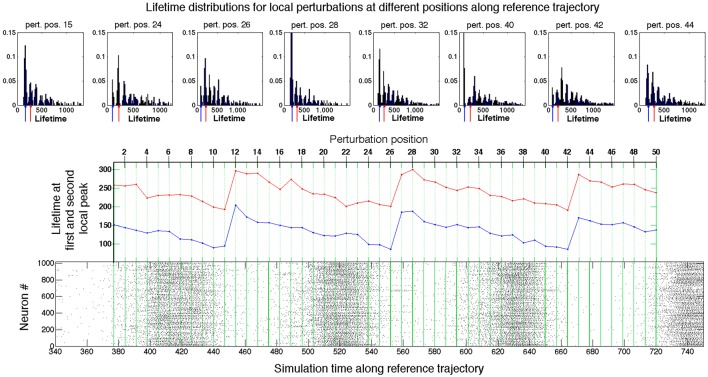
Figure 4.
Probing the neighborhood of the chaotic set. Bottom panel: Raster plot of the spiking activity in the network during the motion on the reference trajectory. Green lines: positions of perturbation along the reference trajectory (see text for details). Top panel: Exemplary distributions of lifetimes at different perturbation positions. Middle panel: Dependence of the first two peaks in distributions of lifetimes on the position of perturbation along the reference trajectory. Red: first peak; blue: second peak.

