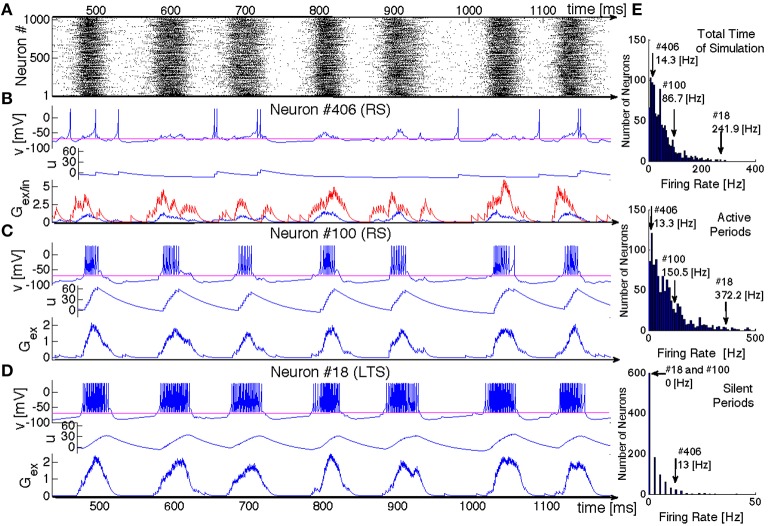
Figure 6.
SSA state in a network of hierarchical level H = 0 with LTS inhibitory neurons and a mixture of excitatory neurons: 80%RS and 20%CH. (A) Raster plot: spiking activity of the network within 700 ms. (B–D) Evolution of variables for three exemplary neurons. Top panels: voltage v, middle panels: recovery variable u, bottom panels: synaptic conductances Gex (in blue) and Gin (in red). Neurons # 406 and # 100 are excitatory RS. Neuron # 18 is inhibitory LTS. (E) Distributions of mean firing rates for all neurons in the network: for the whole duration of the SSA state (upper histogram), for the epochs of high network activity (middle histogram), and for the epochs of low network activity (bottom histogram). Positions of three neurons shown in (B–D) in these distributions are indicated by arrows.

