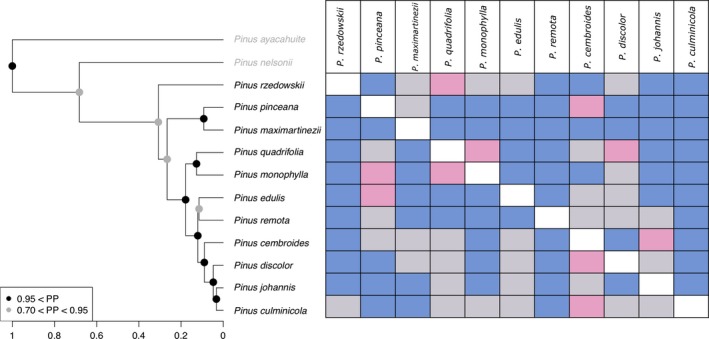
Figure 2.

Maximum clade credibility tree and niche evolution pattern. Niche divergence dominates the niche evolution pattern of the clade. Circles on the nodes of the tree indicate posterior probability support values. Blue cells indicate divergence, pink conservatism, and gray nonsignificant.
