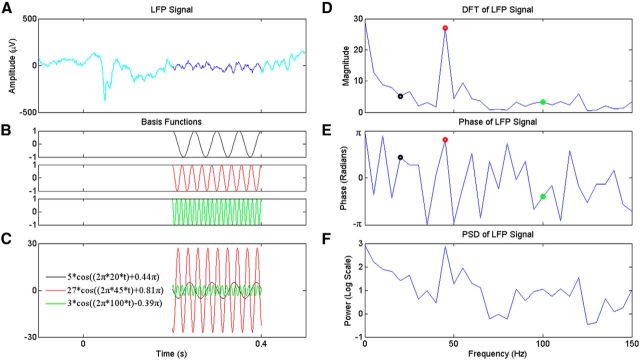
Figure 1.
FT analysis of the LFP signal. A, A sample LFP signal recorded from primary visual cortex. The segment taken for FT analysis is highlighted in dark blue. B, Examples of basis functions available for the FT analysis at 20 (black), 45 (red), and 100 (green) Hz. C, Scaled and phase-shifted versions of the basis functions (shown in B). Scaling factors and phases are obtained from FT. D, E, Magnitude (D) and phase (E) of the FT calculated on the LFP segment highlighted in A. The magnitude and phase of the basis functions are marked in their corresponding colors and used in the equations shown in the legend of C. F, PSD of the LFP (in logarithmic scale). Note that we describe FT (and all other methods) in continuous time even though we perform the analyses on discrete signals (and therefore use DFT).

