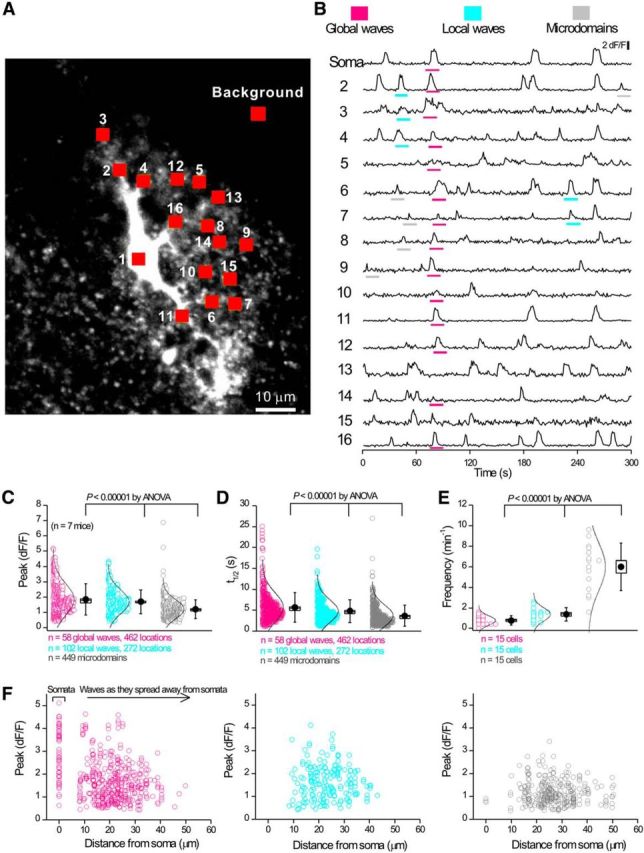
Figure 2.

Striatal astrocytes in C57BL/6N mice display three types of intracellular Ca2+ signals. A, Image of a striatal astrocyte expressing GCaMP3 with 16 ROIs indicated. B, Representative traces from the 16 ROIs shown in A. Global waves, local waves, and microdomains are highlighted in separate colors. C–E, Scatter graphs for average data for traces such as those in B show that the three types of Ca2+ signals differ in amplitude, half-width, and frequency. Statistical tests in C–E were done using one-way ANOVA. F, Scatter graph of amplitude against distance (from the soma) for the three types of intracellular Ca2+ signals. Local waves and microdomains largely occurred in branches. Statistical comparisons were made using one-way ANOVA. For the box-and-whisker plots in C–E, the circle represents the mean, the box the SEM, and the whisker the SD.
