Figure 3.

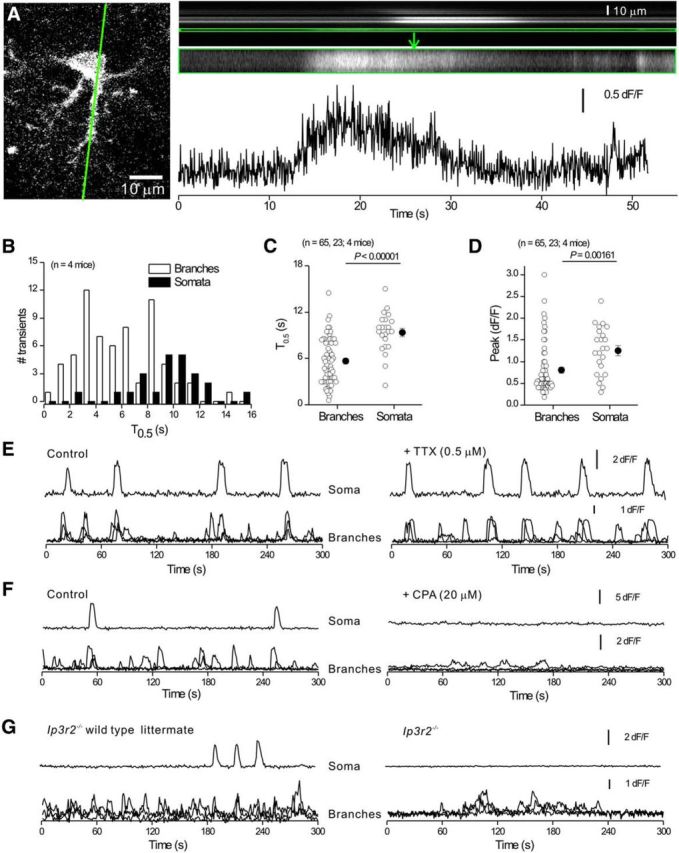
Properties of intracellular Ca2+ signals in striatal astrocytes in C57BL/6N mice. A, Confocal image of a striatal astrocyte with a green line indicating the approximate position of the region chosen for 200 Hz line scan imaging. Top right, Line scan imaging data for the green line, with an expanded region corresponding to a branch shown below. In these images, the x-axis is time and the y-axis is distance along the scanned line. The trace is plotted for the selected region (framed in green) shown in the recorded image above. B, Distributions showing Ca2+ signal half-widths from line scan experiments for somatic and branch regions. C, D, Scatter plots summarizing Ca2+ signal properties such as amplitude and half-width for line scan data. Statistical tests in C and D were using unpaired Student's t test. E, F, Representative single trace for the soma and three superimposed traces for branches under control conditions and then in the presence of TTX (E) or CPA (F). G, Representative single trace for the soma and three superimposed traces for branches for spontaneous Ca2+ signals recorded from Ip3r2−/− mice and their WT littermates. Average data for TTX, CPA, and Ip3r2−/− experiments (and WT controls) are shown in Table 1. In some cases, the error bars signifying SEM are smaller than the symbols used.
