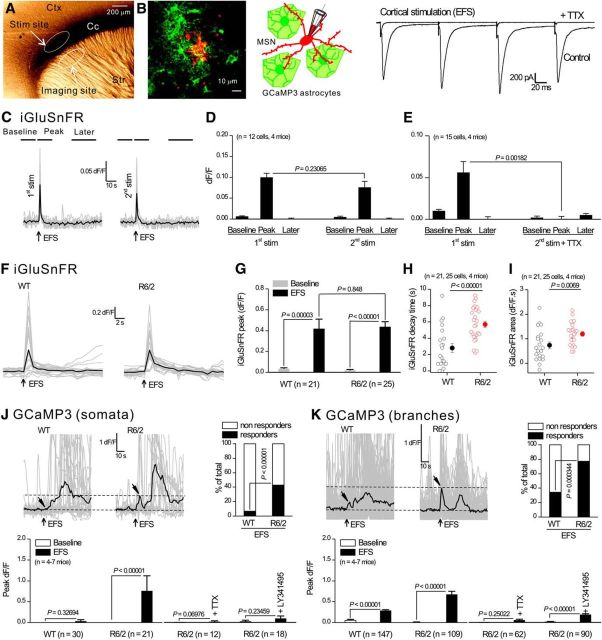
Figure 5.
Striatal astrocytes in R6/2 mice displayed robust Ca2+ signals in response to cortical axon EFS, but those in WT mice did not. A, Photomicrograph of a parasagittal slice of mouse brain showing the position of the stimulating electrode and the imaging site. B, Confocal image (left) and diagram (middle) showing GCaMP3-expressing astrocytes (green) and a MSN filled through the patch-pipette with Alexa Fluor 546. To the right are evoked EPSCs recorded from a MSN in response to 3 EFS; these were abolished in the presence of TTX (0.5 μm). C, Representative traces for a 2-pulse protocol in which 4 EFS were applied twice (first and second stimulation) to cortical axons 10 min apart. Individual traces (gray) and averages (black) for iGluSnFR imaging are shown in response to 4 EFS (arrows). The lines on top of the traces illustrate the time windows in which the peak of the three phases including the baseline, the peak, and later epochs were measured. D, Average data for peak amplitude measured at the three epochs shown in C. E, As in D, with two pulses of 4 EFS at an interval of 10 min, but with the second pulse in the presence of TTX. Note that 2 rounds of 4 EFS produced similar peak responses, whereas interpulse application of TTX abolished the second response. F, Individual traces (gray) and averages (black) for iGluSnFR imaging in response to EFS (arrows) for astrocytes from WT and R6/2 mice. G–I, Average data for peak amplitude, area, and kinetics for traces such as those shown in F. J, K, Top left, Individual traces (gray) and averages (black) for GCaMP3 imaging within somata (J) or branches (K) of astrocytes in WT and R6/2 mice, with arrows indicating the time points for EFS and peak response. Note that a delayed slow response was present in both WT and R6/2, but this slow response was not abolished by TTX (see main text). The graphs next to the traces show the percentage of cells responding to EFS. The bar graphs below the traces show average data for peak responses in response to EFS under various conditions for somata and branches. In some cases, the error bars signifying SEM are smaller than the symbols used.

