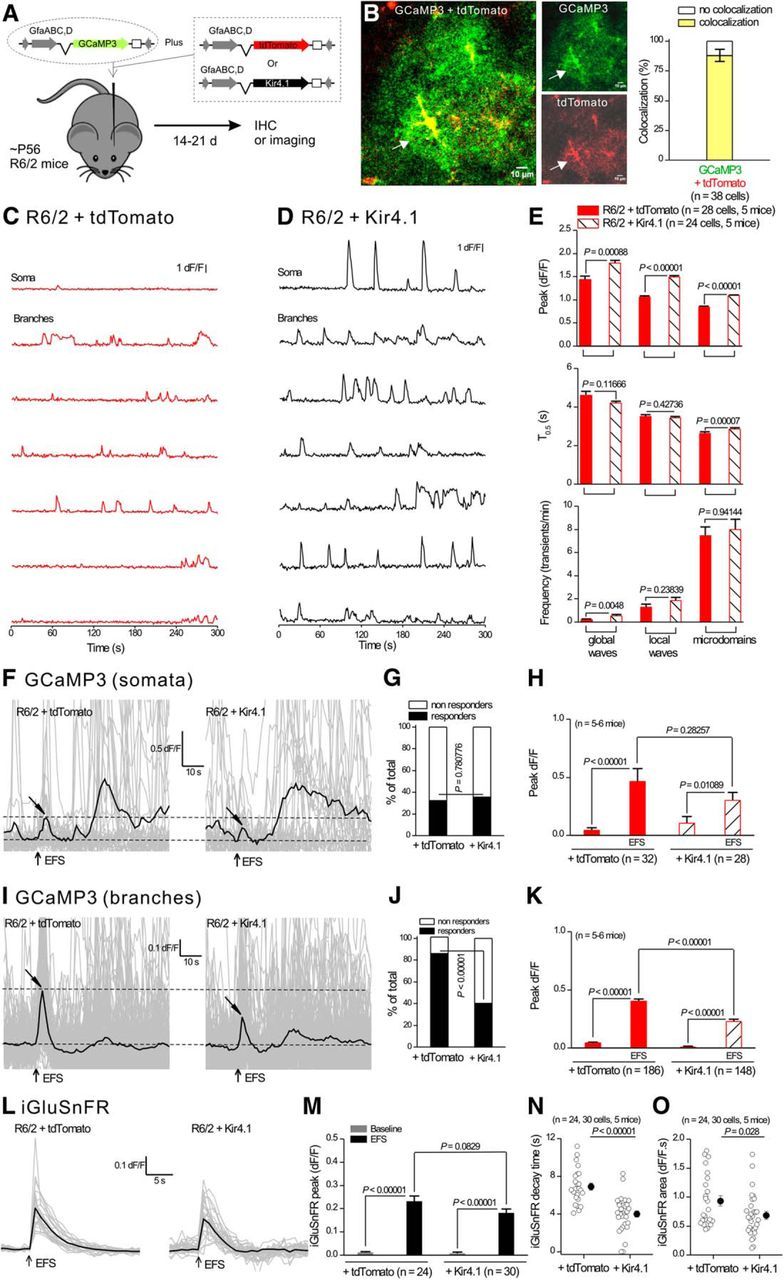
Figure 9.

AAV2/5-mediated Kir4.1 expression within astrocytes rescued dysfunctional astrocyte Ca2+ and glutamate signaling in R6/2 mice. A, The diagram illustrates the viral constructs used, and that the mice were microinjected at ∼P50–P56 and studied at P70–P80. B, Confocal imaging for GCaMP3 and tdTomato shows colocalization when two viral constructs were coexpressed in striatal astrocytes. C, D, Representative traces from seven selected ROIs showing enhanced spontaneous Ca2+ signals in astrocytes from R6/2 mice that had received AAV2/5 Kir4.1 (D) compared with R6/2 mice receiving AAV2/5 tdTomato (C). E, Quantification of peak amplitude, duration, and frequency for the three types of Ca2+ signals in striatal astrocytes in R6/2 mice receiving AAV2/5 Kir4.1 or AAV2/5 tdTomato. F, Individual traces (gray) and averages (black) for eight EFS-evoked Ca2+ signals within somata of astrocytes in R6/2 mice receiving AAV2/5 Kir4.1 or AAV2/5 tdTomato. Tilted arrows indicate the peak of the response. G, Bar graph showing the percentage of cells responding to EFS. H, Average data for peak amplitude from traces such as those shown in F. I–K, As in F–H, but for measurements from branches instead of somata. L, Individual traces (gray) and averages (black) for eight EFS-evoked iGluSnFR signals within astrocyte territories from R6/2 mice receiving AAV2/5 Kir4.1 or AAV2/5 tdTomato. M–O, Quantification of peak amplitude, area, and kinetics for traces such as those shown in L for iGluSnFR. In some cases, the error bars signifying SEM are smaller than the symbols used.
