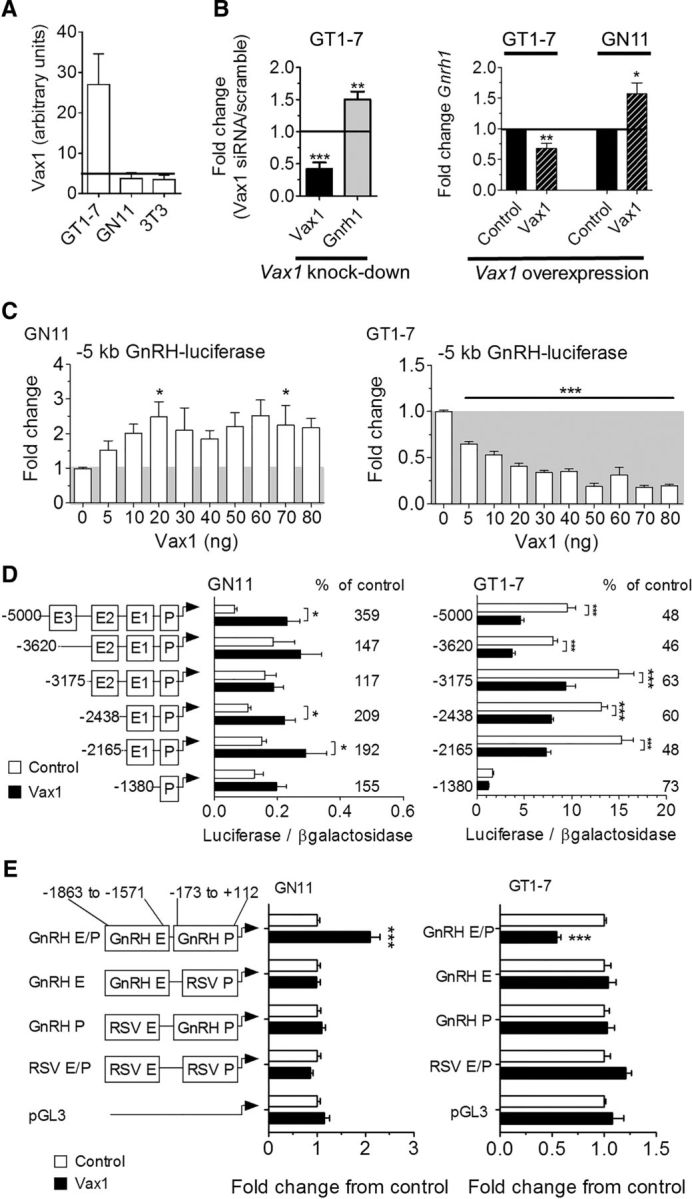
Figure 5.

VAX1 regulates Gnrh1 transcription through the GnRH enhancer 1 and promoter. Levels of Vax1 mRNA were determined by A, qRT-PCR in a mature GnRH cell line (GT1-7), an immature GnRH cell line (GN11), and NIH3T3 fibroblasts (3T3). The horizontal bar indicates lowest detectable RNA level. n = 6–8. B, GT1-7 cells were transfected with siRNA containing a scrambled or Vax1 sequence. Endogenous RNA levels of Vax1 or Gnrh1 were determined by qRT-PCR. Data represent fold-change compared with scrambled siRNA; N = 3–5 in duplicates. Statistical analysis by Student's t test compared with control. *p < 0.05, **p < 0.01. C, Left, GT1-7 cells were transfected with a Vax1-expression vector (Vax1, black hatched) and its empty vector (control, black). Right, GN11 cells were transfected with Vax1-expression vector (Vax1, black hatched) and its empty vector (control, black). Data represent fold-change compared with empty vector. Statistical analysis by Student's t test compared with control. *p < 0.05, **p < 0.01. C, GN11 and GT1-7 cells were cotransfected with a luciferase reporter driven by the 5 kb promoter region of the rat GnRH gene and increasing concentrations of Vax1. All samples were transfected with equal amounts of DNA by using the empty CMV vector. Statistical analysis by one-way ANOVA followed by Tukey post hoc. *p < 0.05, ***p < 0.001. D, Cotransfection with 5′ truncations of the GnRH 5 kb promoter driving luciferase with (black) or without (white) 10 ng of Vax1. Luciferase data are expressed as fold-induction compared with pGL3. The percentage change between cotransfection with 0 versus 10 ng of Vax1 on the reporters is indicated on the graph. Statistical analysis by two-way ANOVA followed by Dunnett's multiple comparison. *p < 0.05, **p < 0.01, ***p < 0.001. E, Vax1 regulation of the RSV enhancer/promoter (RSV E/P) driving luciferase with or without the GnRH enhancer 1 (GnRH E, −1863 to −1571 bp) or GnRH promoter (GnRH P −173 to +112 bp). Data are expressed as fold-induction compared with empty vector for each reporter. Statistical analysis by Student's t test. ***p < 0.001. Luciferase transfection studies represent n = 3–5 performed in triplicate.
