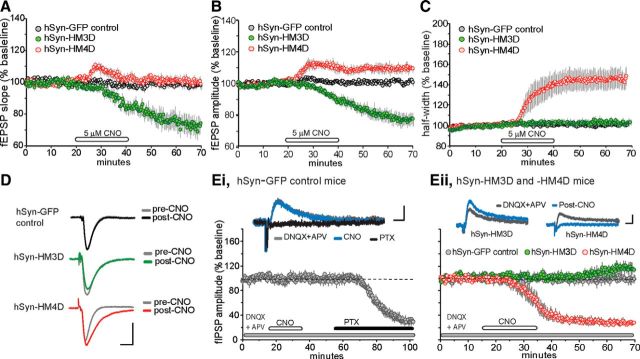
Figure 2.
Characterization of baseline synaptic transmission in hippocampal slices expressing hSyn-driven excitatory and inhibitory DREADD receptors. A–C, Hippocampal slices were prepared from adult hSyn-GFP control (gray circles; n = 6), hSyn–HM3D (green circles; n = 7), and hSyn–HM4D (red circles; n = 6) mice. The graphs show the mean ± SEM fEPSP slope (A), amplitude (B), and half-width plotted as a percentage change of baseline (C) in hippocampal slices treated for 20 min with 5 μm CNO, followed by a washout. D, Representative field responses collected from hSyn-GFP control, hSyn–HM3D, and hSyn–HM4D slices during the baseline recording period (pre-CNO) and 30 min after the end of CNO infusion (post-CNO). Calibration: 1 mV, 5 ms. E, i, Pharmacologically isolated fIPSP amplitudes (responses recorded in the presence of 20 μm DNQX and 100 μm APV, antagonists for AMPA and NMDA receptors, respectively) were evoked by stimulation of the Schaffer–commissural projections (pre-CNO, gray line, top trace) in slices prepared from hSyn-GFP control animals (n = 5 slices). Graph shows the mean ± SEM change in fIPSP amplitude as a percentage change of baseline. These responses were completely blocked by the GABAA receptor antagonist PTX (black line, top traces) and were unaffected by infusions of 5 μm CNO (blue line, top traces). Calibration: 0.1 mV, 10 ms. ii, In slices prepared from hSyn–HM3D mice (n = 7 slices), CNO infusions produced a delayed but significant increase in the fIPSP. In contrast, CNO infusions mimicked the effects of PTX by causing a dramatic decrease in the fIPSP and completely eliminating the field response 30 min after the end of the infusion period in slices (n = 5) from hSyn–HM4D mice. fIPSPs were unaffected by infusions of CNO in slices from hSyn-GFP controls (n = 5) during the recording session. Calibration: 0.1 mV, 10 ms.

