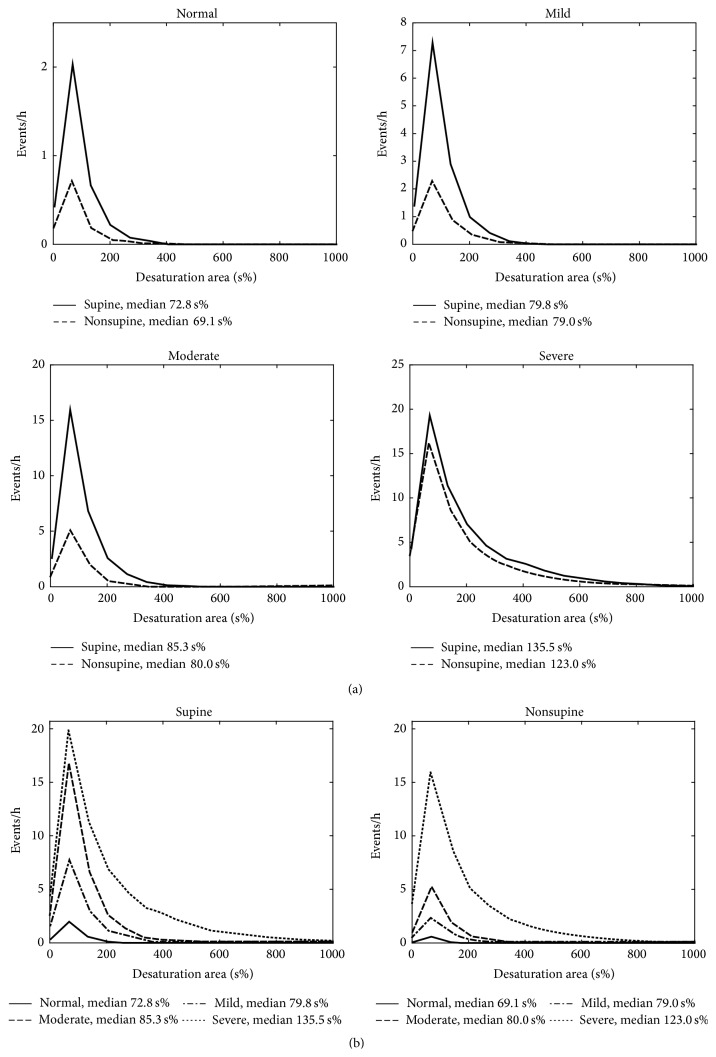
Figure 2.
(a) Positional sleeping time adjusted distributions of the areas of individual desaturation events in supine and nonsupine positions in different OSA severity categories and (b) distributions in nonsupine and supine positions as a function of OSA severity. In all OSA severity categories the areas of the desaturation events are larger in the supine position compared to the nonsupine position. Based on mixed model analysis, the differences are statistically significant in the moderate and severe OSA severity categories. The median desaturation areas increase along increasing OSA severity in both supine and nonsupine positions.

