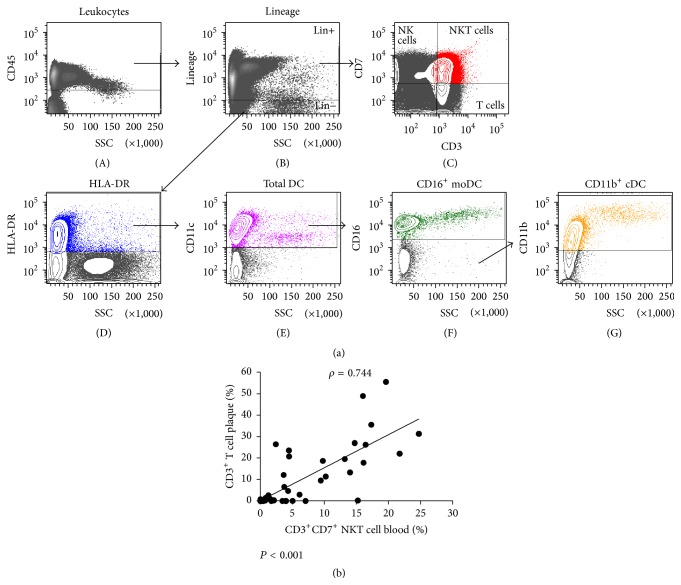
Figure 5.
Leukocyte subsets and correlation analysis in human plaques and blood. (a) Gating strategy for the analysis of leukocyte(s) (subsets) in human plaque and blood samples. After staining the leukocyte population using a CD45 pan leukocyte antibody (A), lineage markers (= a CD3, CD14, CD19, CD20, and CD56 cocktail) were used to separate the DC (lineage−) from the other immune cells (lineage+) (B). Within the lineage+ cells we identified T cells, NK cells, and NKT cells, which were defined as CD3+, CD3− CD7+, and CD3+ CD7+, respectively (C). cDC were then identified as positive for HLA-DR (D) and CD11c (E). CD16 was used for the staining of monocyte-derived DC (F). Subsequently, CD11b+ cDC (G) were gated from the CD16-negative population. Within the lineage+ population we identified monocytes in blood as HLA-DR+ CD11c+ CD11b+ CD14+ and macrophages in plaques as HLA-DR+ CD11c+ CD11b+ CD68+ (plots not shown). (b) Spearman's rank correlation plot showing the relationship between CD3+CD7+ NKT cell numbers in blood and the percentage of total CD3+ T cells in plaques obtained from the same endarterectomy patient (n = 57).

