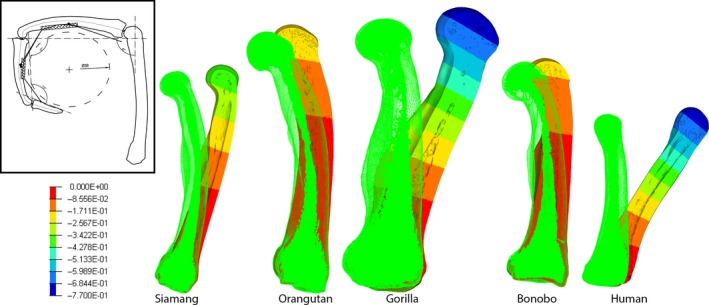
Figure 5.

Micro‐finite element (μFE) modelling of the primate phalanx. Using micro‐CT, the true trabecular and cortical structure of the third proximal phalanx is modelled using μFE in a static, suspensory posture (left inset image). The biomechanical model was validated by Richmond (2007) and tested via μFE (Nguyen et al. 2014) on siamang phalanges. Here, this model is used to look at the displacement (how much the bone deforms under loading) across different extant hominoid taxa. Here, the displacement is 30 × greater than actual so the deformation can be visualized. Due to variation in trabecular structure, cortical thickness and phalangeal curvature, one can see substantial variation in how well each phalanx copes with the external loading during a suspensory posture. Orangutans and bonobos show the least displacement, while gorilla and humans show the most. Adding fossil phalanges to this comparative context will provide greater insight into how well their external and internal morphology could cope with the compression and bending stress of suspensory grasping.
