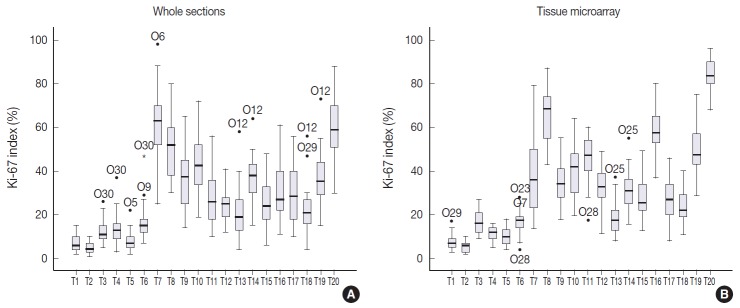
Fig. 3.
Side-by-side box plots of Ki-67 distribution using whole sections (A) and tissue microarray slides (B) in direct counting method. The box shows the first to third quartiles, the horizontal line inside the box represents the median, the whiskers extend to minimum and maximum values within 1.5 times the interquartile range (IQR) from the first and third quartiles. Outliers are represented by small circles and extreme values (more than 3 times IQR) by asterisks. The Ki-67 indices measured in whole section show wider distribution than those in tissue microarray.

