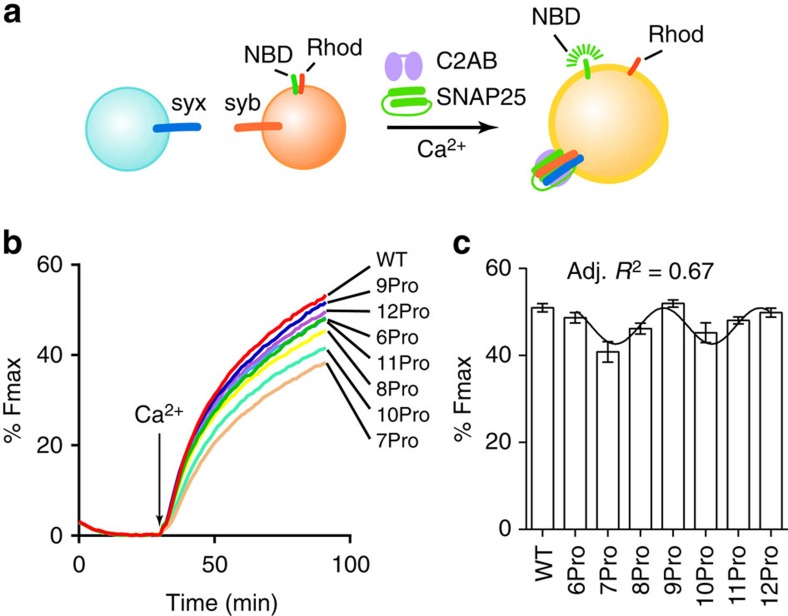
Figure 2. Analysis of syt linker mutant activity in reconstituted fusion reactions.
(a) Schematic diagram of the reconstituted fusion system; the fluorescence resonance energy transfer donor (NBD) fluorescence increases, because of dequenching, upon fusion. (b) Representative traces of reconstituted membrane fusion reactions regulated by WT or linker mutant forms of syt (3 μM); the arrow indicates the addition of Ca2+ (1 mM, free). (c) The extent of fusion 1 h after addition of Ca2+ was plotted and found to be periodic, with a period of three. Data are represented as mean±s.e.m. For each condition, three independent trials were carried out. Data were fitted using a sine wave function with a periodicity of three; an adjusted (Adj.) R2 value was generated to assess the goodness of the fit.

