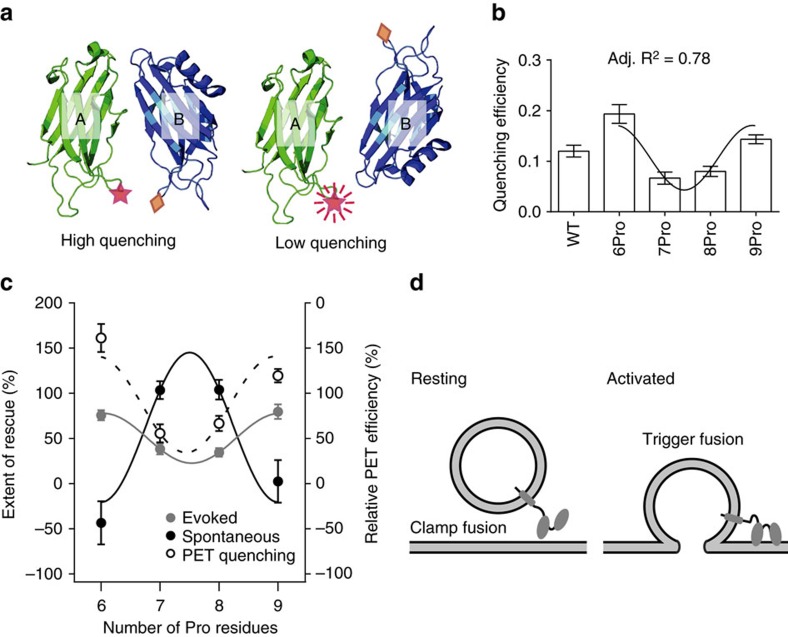
Figure 6. Distinct relative C2-domain orientations underlie syt regulation of evoked and spontaneous release.
(a) Illustration showing the PET quenching assay, showing the quenching Trp (diamond) and the BODIPY fluorophore (star) that is quenched, in the membrane penetration loops of C2A and C2B, respectively. (b) The quenching efficiencies were calculated and plotted for the WT and 6–9Pro mutants; 0.5 μM protein was used in each condition. Data were fitted using a sine wave function with a periodicity of three; an adjusted (Adj.) R2 value was generated to assess the goodness of the fit. The most efficient quenching was observed for 6Pro and 9Pro, so the C2-domains in these two constructs point in the same direction; for 7Pro and 8Pro, the C2-domains are not in a parallel relative orientation. Data are represented as mean±s.e.m.; for each condition, three independent trials were carried out. (c) Reciprocal abilities of the syt linker mutants to clamp spontaneous release and to drive evoked synaptic transmission. The amplitude of evoked EPSCs and the frequency of mEPSC were used to evaluate the function each linker mutant. Data were normalized using values obtained from WT (100%) and syt KO neurons (0%). Again, the results were fitted with a sine wave function with a periodicity of three; an adjusted R2 value was generated to assess the goodness of the fit. For completeness, the PET quenching data were normalized and overlaid onto this plot, to reveal the relative orientations that underlie the regulation of evoked versus spontaneous release. (d) Under resting conditions, C2A and C2B point to different directions to clamp fusion; when activated by Ca2+, C2A and C2B switch to a parallel configuration to trigger SV exocytosis.

