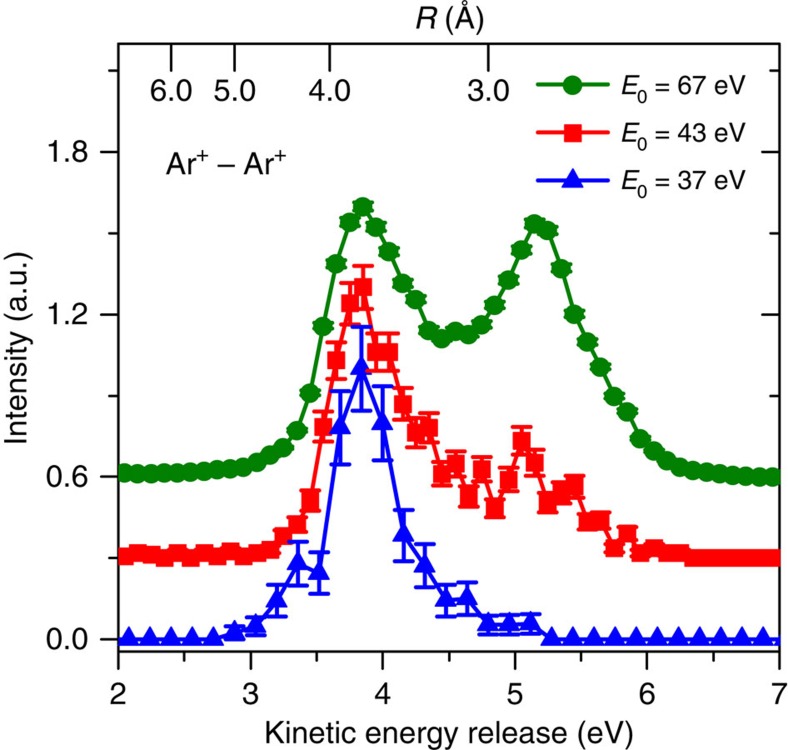
Figure 2. Measured kinetic energy of Ar+ ion pairs.
KER spectra for the production of two repulsive Ar+ ions after break-up of the dimer at projectile electron energies of E0=37 (blue triangles), 43 (red squares) and 67 eV (green circles). The spectra are normalized at the 3.8-eV peak, and for better visibility the data for E0=43 and 67 eV are shifted upwards by 0.3 and 0.6 a.u. (arbitrary units of signal intensity), respectively. The top scale shows the internuclear distance R at the instant when Coulomb explosion starts, that is, when the second Ar atom is ionized. R is determined from the associated Coulomb repulsion potential, which in good approximation corresponds to the observed KER. The error bars of the data points are defined as s.d. and are calculated as square root of the experimental count number.

