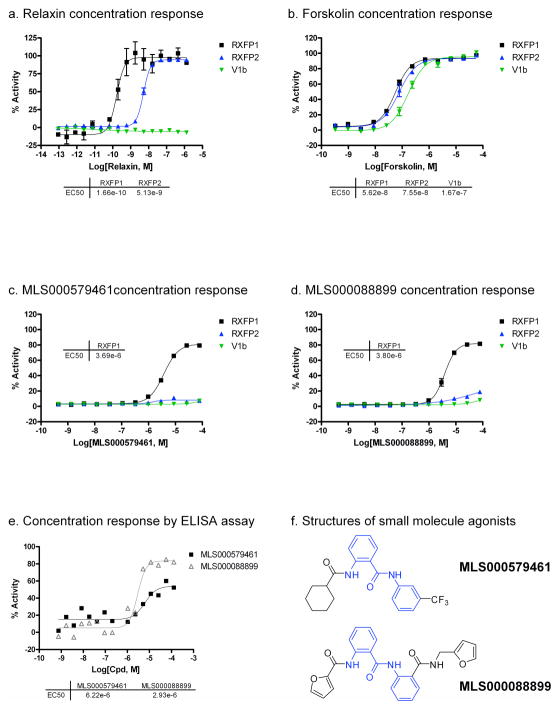
Figure 3. Concentration response of human RXFP1 agonists.
HTRF cAMP response in HEK293-RXFP1 (black), HEK293-RXFP2 (blue) and HEK293-V1b (green) cell lines and per cent viability (gray) for (a) relaxin, (b), forskolin, (c) MLS000579461 and (d) MLS000088899. (e) Concentration response of MLS000579461 and MLS000088899 in ELISA cAMP assay. (f) Structures of the two lead compounds. Cyclic AMP activities of compounds were normalized to the maximal response of forskolin (57.5 μM) as 100% activity and DMSO control (0.58% DMSO) as 0% activity.

