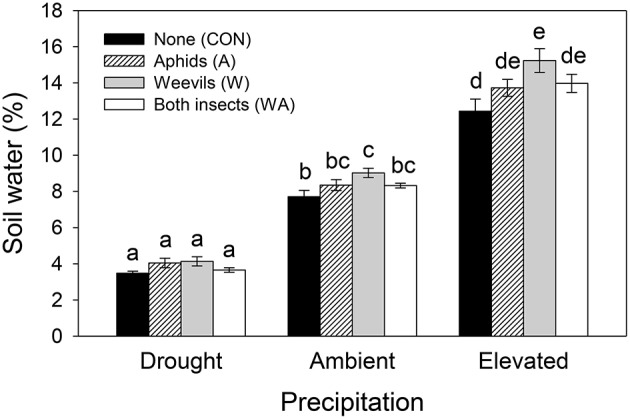
Figure 2.

The interactive effects of precipitation and herbivore treatment on soil water content. Mean values (±SE) are shown. Bars with the same letters were not significantly different (P < 0.05).

The interactive effects of precipitation and herbivore treatment on soil water content. Mean values (±SE) are shown. Bars with the same letters were not significantly different (P < 0.05).