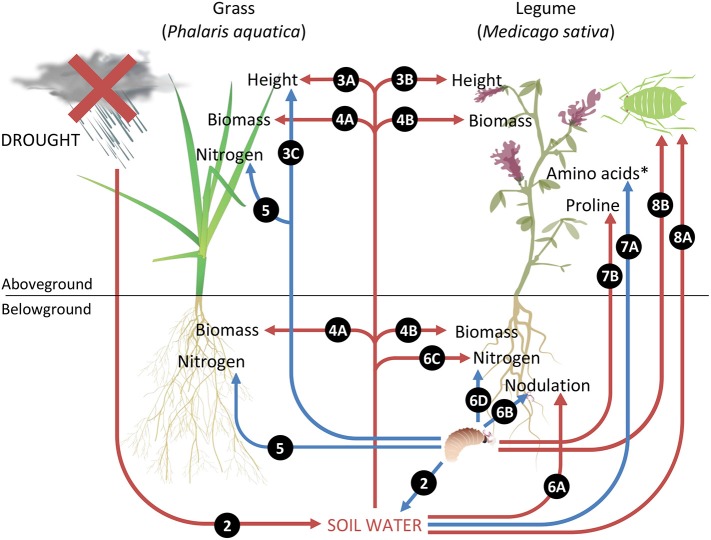
Figure 9.
Summary of key results illustrating plant–herbivore interactions under drought. Red arrows indicate negative impacts and blue arrows represent positive impacts. Numbers refer to relevant figures associated with each effect. *Amino acids represent concentrations of groups one and three amino acids, namely glycine, lysine, methionine, tyrosine, cysteine, histidine, arginine, aspartate, and glutamate.

