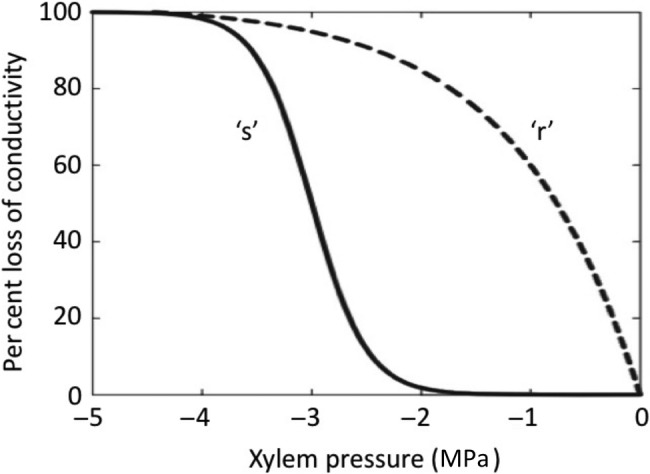
Figure 1.

Representative vulnerability curves showing the change in PLC versus xylem pressure for ‘s’-shaped curves (solid line) and ‘r’-shaped curves (dashed line). ‘r’-shaped vulnerability curves are significantly more vulnerable to cavitation than ‘s’-shaped curves. Redrawn from Cochard et al. (2010a).
