
Figure 3. Percentage of labeled mass isotopomers (100%-M0) in intracellular metabolites from [1,2-13C]glucose, measured at 24 h during growth (mock infection) conditions.
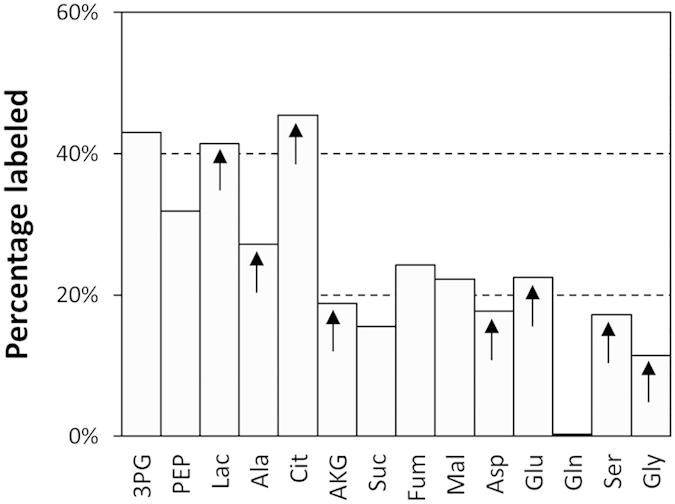
Values were corrected for natural isotope abundance and normalized by the corresponding percentage labeling in extracellular glucose. Arrows indicate that isotopic steady-state has not been reached.