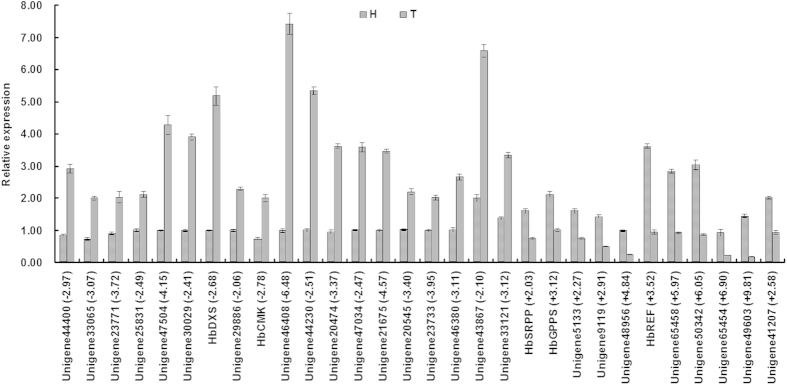
Figure 3. Real-time RT-PCR validation of the DEGs.
Total RNA extracted from healthy and TPD rubber trees was used for real-time RT-PCR analyses, and 18s rRNA was used as the internal reference. H and T represent healthy and TPD rubber trees, respectively. Data represent the mean ± S.D. The number in bracket refers to the log2(H_RPKM/T_RPKM) of the corresponding gene from RNA-seq analyses.

