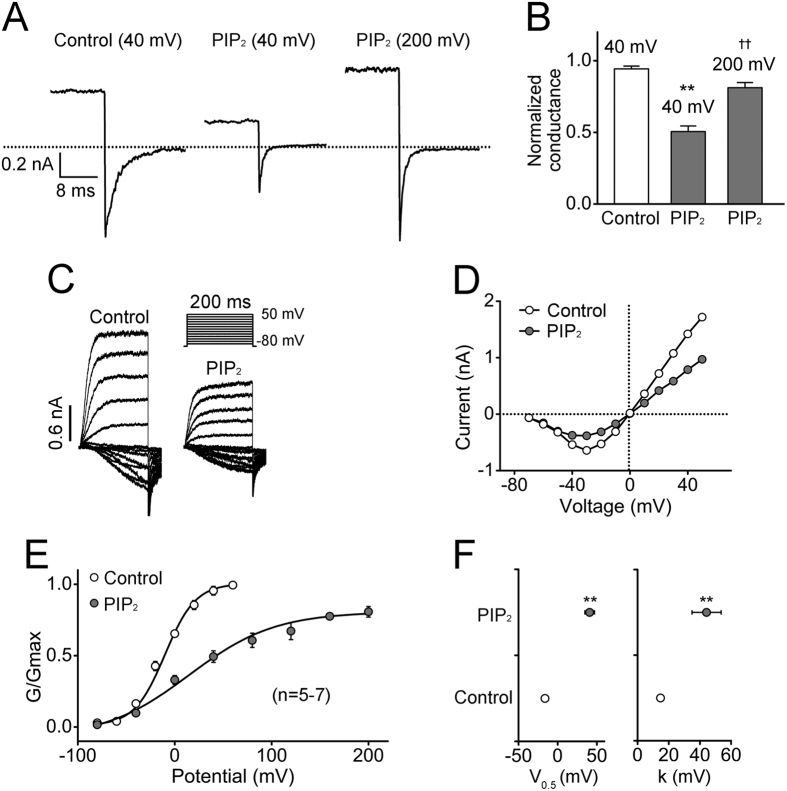
Figure 2. Voltage dependence of hEAG1 channel inhibition by PIP2.
(A) Representative current traces were recorded at −80 mV following depolarization to different voltages indicated. PIP2 was applied at 2 μM. (B) Normalized conductance under the conditions shown in (A). The results obtained in the presence of PIP2 (2 μM) were normalized to the maximal conductance inferred from the tail currents before PIP2 application in each patch. The normalized conductance values were 0.94 ± 0.02, 0.51 ± 0.04 and 0.81 ± 0.04, respectively (n = 6). (C) Illustrative current traces elicited by pulses from −80 to 50 mV in 10 mV increments before and after application of 0.1 μM PIP2. (D) Peak current-voltage curves from the results shown in (C). (E) Normalized conductance-voltage (GV) curves constructed from hEAG1 channel tail currents before and 3–5 min after application of 0.1 μM PIP2. The curves were fitted with a Boltzmann function from the results obtained using the same protocol as in (C). The fit parameters, half-activation voltage (V0.5) and slope factor (k), of voltage-dependent activation of hEAG1 channels before and after PIP2 application (0.1 μM) are shown in (F). **P < 0.01 compared to the control before PIP2 application and ††P < 0.01 compared to after PIP2 application at 40 mV.

