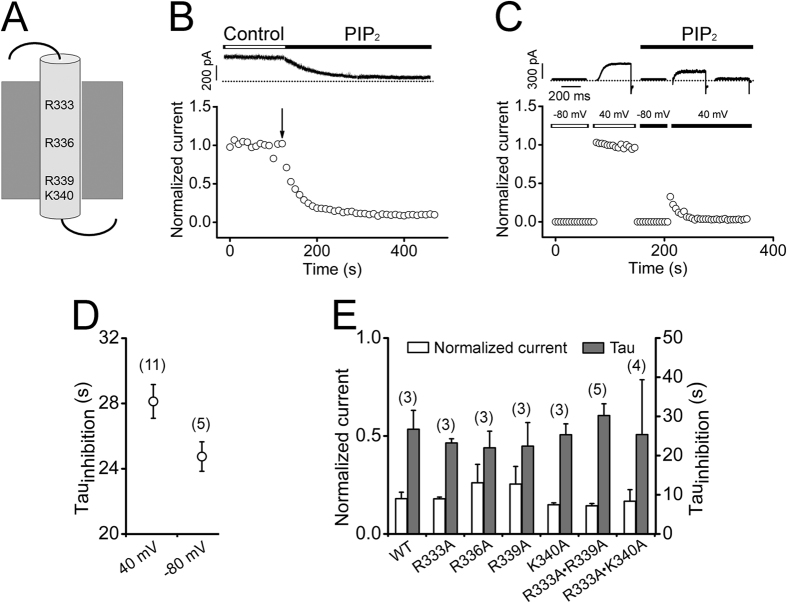
Figure 5. Positive charges in the S4 voltage sensor are not essential for the inhibitory effect of PIP2.
(A) A cartoon showing the positively charged amino acids in hEAG1 S4. (B) Representative current trace (top) and the normalized time course (bottom) of hEAG1 channel currents in an excised patch before and after application PIP2 (3 μM) when the membrane potential was held at 40 mV. The arrow denotes the start of PIP2 application. (C) Representative current traces recorded sequentially at −80 mV, 40 mV, −80 mV, and 40 mV (top), and the normalized time course (bottom) at the membrane voltages indicated. (D) Averaged time constants of PIP2-induced hEAG1 current inhibition at 40 and −80 mV according to the protocols in (B,C) respectively. (E) Summary of the normalized peak current and averaged time constants (Tau) of PIP2-induced current inhibition at 40 mV in wild-type and mutant hEAG1 channels. The time constants were obtained from single-exponential fits to the normalized current inhibition by PIP2.

