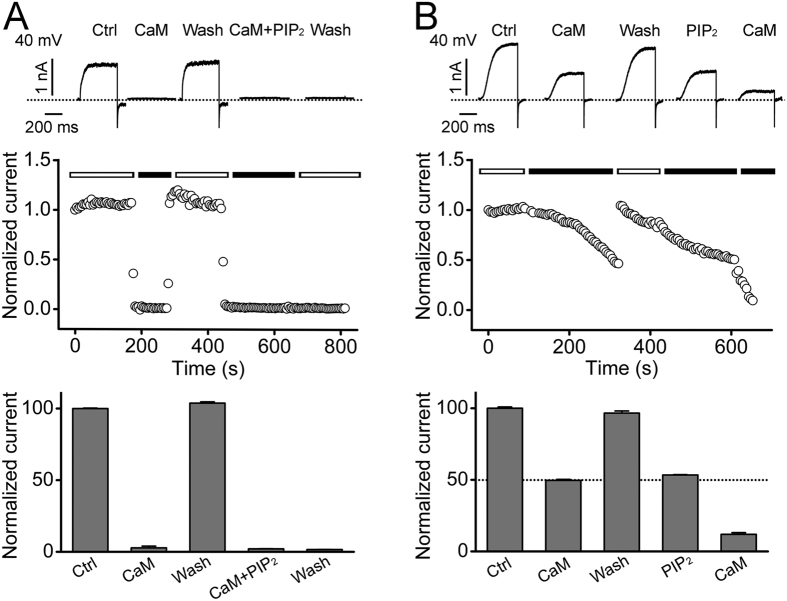
Figure 7. CaM- and PIP2-induced hEAG1 channel inhibition.
(A) Representative current traces (top), the time course of the normalized peak current (middle) and the summarized normalized peak current (bottom) of hEAG1 channels recorded at 40 mV in excised patches before and after sequential applications of CaM (200 nM) and PIP2 (3 μM) as indicated (n = 4). (B) Representative current traces (top), the time course of the normalized peak current (middle) and the summarized current inhibition (bottom) of hEAG1 channels recorded at 40 mV in excised patches before and after sequential applications of CaM (30 nM) and PIP2 (0.5 μM), both of which induced around 50% current inhibition as shown by the dotted line (n = 3). The internal Ca2+ was buffered to 1 μM in both (A,B).

