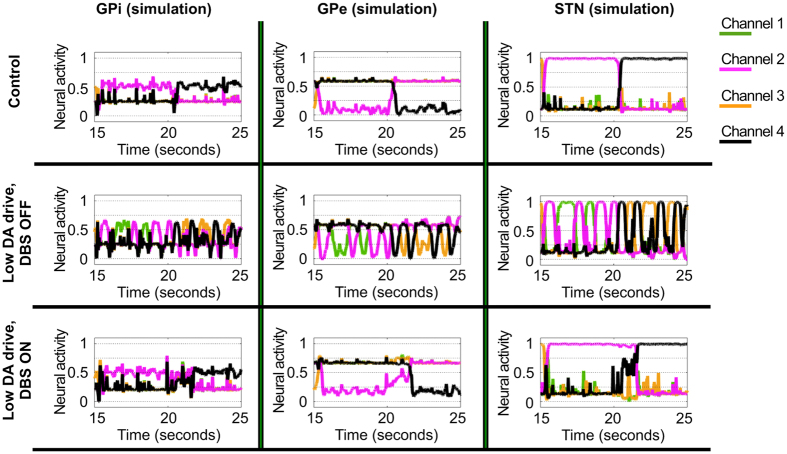
Figure 5. Simulated oscillatory neural activity in the BG under the condition of healthy control, low DA drive (DBS off) and high DA drive (DBS on).
Simulated activity recorded in the Globus Pallidus (pars interna: GPi, and pars externa: GPe) and the subthalamic nucleus (STN) in the three conditions of control and low DA drive, on and off-stimulation. The graphs report 10 seconds of activity (range between 15 and 25) resulting in the action selection reported in the case study represented in Fig. 4. The colorcode is used to represent the activity of neural units belonging to the same channel, within different neural regions. The selected time interval highlights the presence of both slow (frequency of 0.5–2 Hz) and ultra-slow oscillatory patterns (frequency <0.5 Hz). The first type is mainly induced by the switching function realised by the short indirect pathway, whereas the second results from the maintenance function regulated by the direct pathway.

