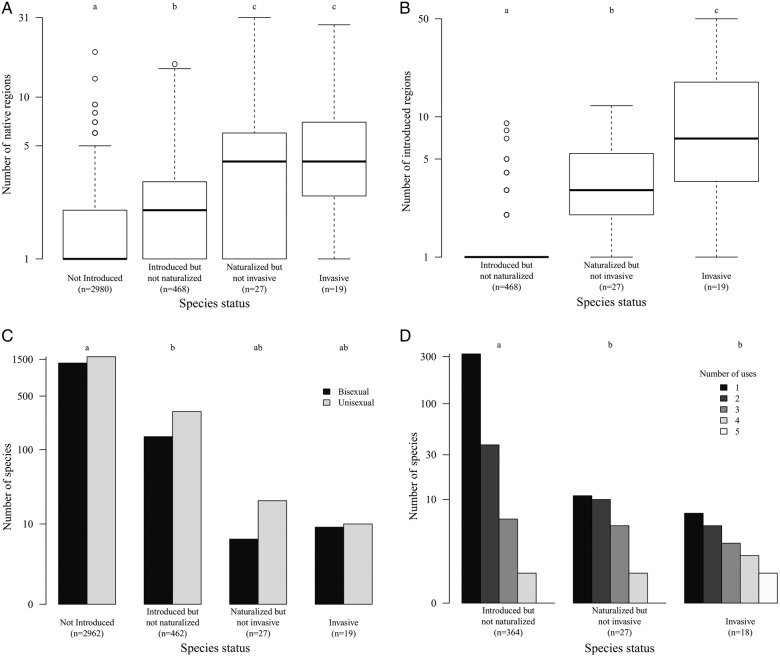
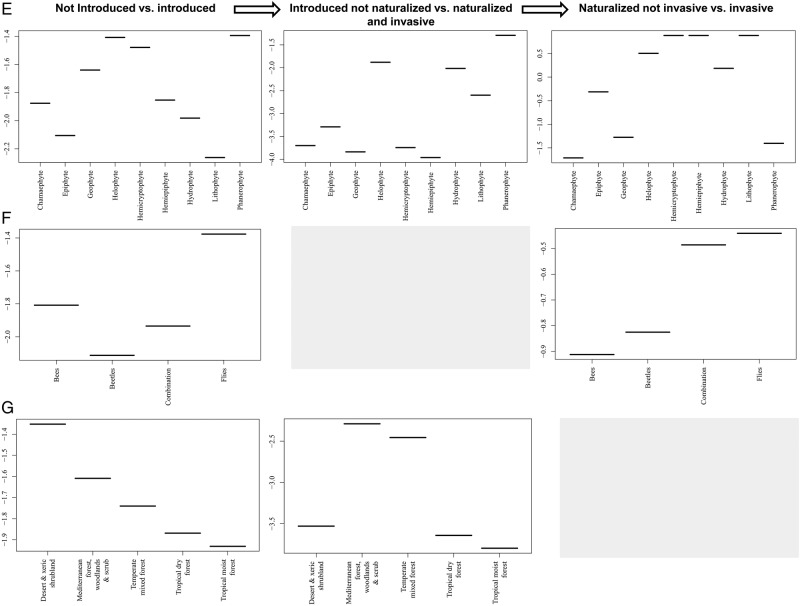
Figure 2.
The relationship between the introduction status of Araceae species and the parameters found to have a significant effect using BRTs. (A) Invasive taxa have larger native range sizes. Native range size is measured here in terms of the number of floristic regions based on Good's (1974) classification. Araceae naturally occur in 34 of the 37 floristic regions. (B) Invasive species tend to have been introduced to more regions than naturalized species, and almost 90 % of species that have been introduced to only one region have not yet naturalized. (C) Species with unisexual flowers tend to have overcome more of the barriers to invasion than species with bisexual flowers. (D) Species with a broad range of uses have naturalized and become invasive more often. Six different categories of human usage were considered: food source, medicine, fibre production, horticulture, agroforestry and phytoremediation. (E) Different life forms varied in their importance at different stages of the invasion. (F) Species that were fly pollinated or had a combination of pollinator types were introduced and became invasive relatively more frequently than bee- or beetle-pollinated species. (G) Species native to Mediterranean and temperate mixed forests tend to naturalize more often. There were few data on the human uses of species that had not been introduced outside their native range, and so this category was excluded. In (A and B), the box is the interquartile range, and the bold centre line is the median. Different letters denote different values using Tukey's multiple comparisons of means test. In (E–G), tests were done using the original data, though the panels actually show plots of the fitted functions produced by BRTs, which indicate the effect on species presence/absence across the INI stages (y-axes) by each predictor variable (x-axes). For the relative contribution of each variable to the total deviance explained, see Table 3. Grey panels indicate factors with low importance in the INI continuum, and therefore excluded from the model.


