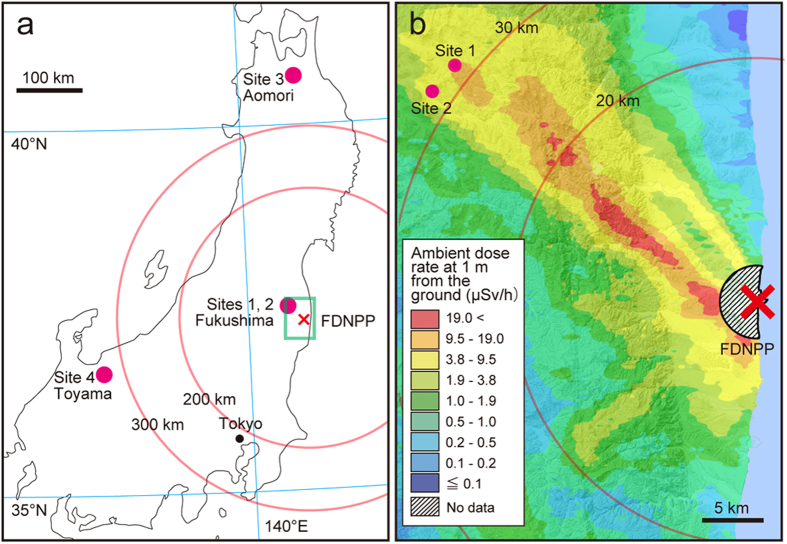
Figure 1. Capture sites for large Japanese field mice used for this study (a) and ambient dose rate 30 months after the Fukushima Daiichi Nuclear Power Plant (FDNPP) accident (b).
The region in the green box in panel ‘a’ is shown enlarged in panel ‘b’. The map in panel ‘a’ was created using royalty-free digital map source software (MAPIO ’05-’06 nenndo-ban JAPAN, DesignEXchange, Tokyo, Japan). The map in panel ‘b’ with ambient dose rate data was created from ‘Extension Site of Distribution Map of Radiation Dose, etc.,/ Digital Japan’ (http://ramap.jmc.or.jp/map/eng/map.html, Accessed 4 Nov. 2015).

