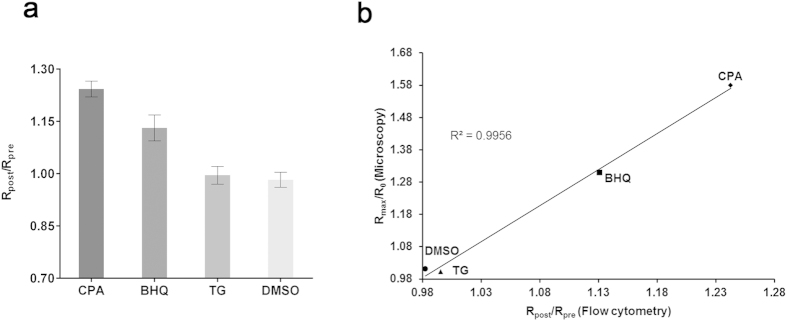
Figure 6. Detection of the cytosolic Ca2+ change in P. falciparum by flow cytometry.
(a) FRET signals are represented by Rpost/Rpre where Rpre is the YFP/CFP ratio before addition of inhibitors and Rpost is the YFP/CFP ratio after addition of inhibitors. The mean and standard error of the mean of Rpost/Rpre were obtained with 15 μM cyclopiazonic acid (CPA), 2 μM 2,5-Di-t-butyl-1,4-butylhydroquinone (BHQ), 7.6 μM thapsigargin (TG) and DMSO from 3 independent experiments. (b) Correlation of FRET signal values obtained by confocal microscopy and the values by flow cytometry. Maximum of FRET signal changes (Rmax/R0) from microscopic analysis and the FRET signal changes (Rpost/Rpre) by flow cytometry are plotted. Linear regression line and the coefficient of determination (R2 = 0.9956) are shown.

