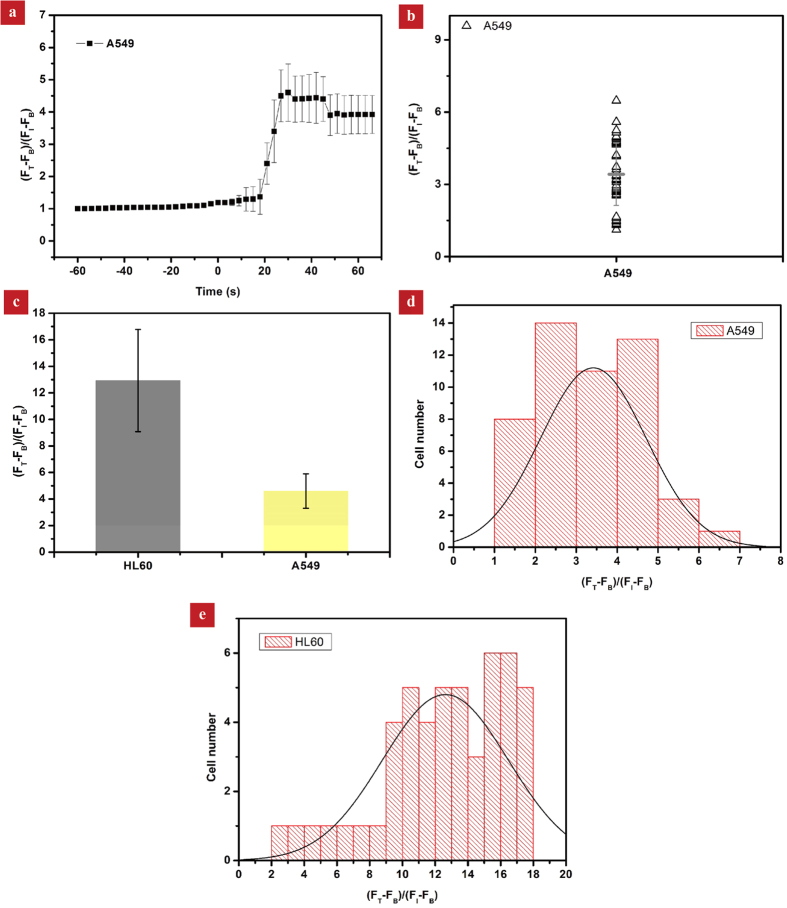
Figure 7.
(a)The variation of the fluorescence signaling of A549 cells (n = 50) as a function of time based on the average of 50 cells. The enhancement factors at ~24 s and ~66 s are 4.6 and 3.9, respectively, both of which are much smaller than that in the case of HL-60 cells. (b) The variation of individual cell calcium responses at ~66 s. (c) The comparison of the magnitude of calcium peaks for two cell lines (HL-60 and A549). (d,e) The statistical distribution of the cellular calcium signal amplification for HL-60 (n = 50) and A549 (n = 50) cells at 66 s, suggesting a notable cell-type-specific differences and single cell heterogeneity.

